


 Q4 2025 Earnings Call Transcript")
")
By Levi at Elliott Wave Trader, produced with Avi Gilburt
While the (SPY) managed a meager +2% gain, in the same time frame Toyota (NYSE:TM) has run some 30%-plus. We talked about this setup back at the end of May in this article: Toyota Motor: Has It Lost That Loving Feeling?. Updated commentary on the fundamentals is provided below, and we take a look at the potential long-term sell setup that could be forming.
Toyota is now nearing what may be a major peak in price. Yes, according to the chart we share below, there may be a few more squiggles higher in the months to come. But it’s now time to tighten up risk management. We provide the following updated commentary regarding the fundamentals.
The Fundamentals With Lyn Alden
Here are Lyn’s comments from the May article:
“Toyota continues to be decent-but-lackluster, with a significant risk of being an ongoing value trap.
The stock is cheap and has a strong balance sheet, and after a big correction it is back down to the lower end of its trading range. This gives it plenty of appreciation potential over the next couple years as it potentially bounces back up to the higher end of its trading range.
However, longer term, it’s hard to see how the company is going to move the needle and provide better shareholder returns. The dividend yield isn’t high enough for a low-growth stock.”
FAST Graphs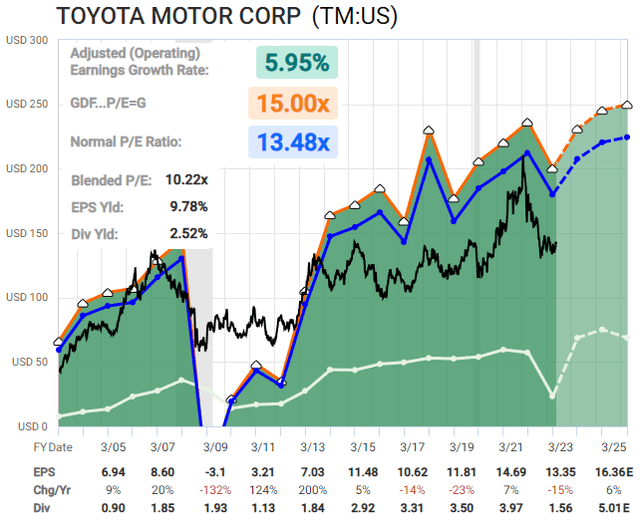
And today, what may be a major factor in the shift to a value trap?
“Over the past three years, China has dramatically ramped up its auto exports from 100,000 per month to 360,000 per month. With this move, China has displaced Japan as the world’s largest auto exporter. We don’t see many of these cars in the United States, but they’re doing well in most countries throughout the world. Toyota and other car manufacturers have a permanent new source of relatively low-cost competition now, and that will likely to continue to pressure them in a similar way that American automakers were pressured years ago by the rise of Japanese exports.”
The value trap thesis will likely begin to gain traction as Toyota’s market share is challenged by these competitors. So, how will we know when the peak of the mountain has been reached? And is there a way to track the structure of price on the chart to provide risk vs reward for a trader/investor?
Our Preferred Methodology To Track What Truly Moves Markets
Yes, fundamentals are important, and at some moment in time, they will matter. What’s more, the smaller the market capitalization of the stock observed, the more fundamentals will weigh on price. The opposite also is true. Sentiment works on a continuum. And sentiment is what truly moves markets. When we use the word “sentiment” it’s simply fear and greed. Basic human behavior and “feelings” manifested right before our eyes in the price on the chart.
So, how do we use these “feelings” to our benefit rather than to our detriment? Our job as market participants is to join in the movement of price and to be on the right side of that more often than not. Seems simple and straightforward, does it not? However, when greed and fear overtake a participant, then said person is no longer an observer of the sentiment in the marketplace, rather they’re now a participant in the sentiment itself. Emotions have now clouded their judgement, and objectivity will likely soon exit stage right.
The trader/investor needs a specific structure to measure sentiment and to indicate what’s the most likely path going forward. We view the markets and the stocks that make them up from a probabilistic vantage point. This means that we seek to identify what is the highest probability outcome and then follow this as our primary path. We also will outline an alternative path should our primary fail.
Garrett Patten Shares The Technical View
Garrett is a senior analyst covering both U.S. and international equity indices as well as stocks. He’s a key contributor of S&P 500 and other index analysis. We cover 10 international indices (FTSE100, DAX, Euro STOXX 50, Nikkei, Hang Seng, India’s Nifty 50, Mexico’s IPC Index, Brazil’s Bovespa, Australia’s ASX 200, & Shanghai Composite) as well as many key stocks from around the globe.
Toyota is part of this ongoing coverage. The latest chart from Garrett:
By Garrett Patten – World Market Waves – Elliott Wave Trader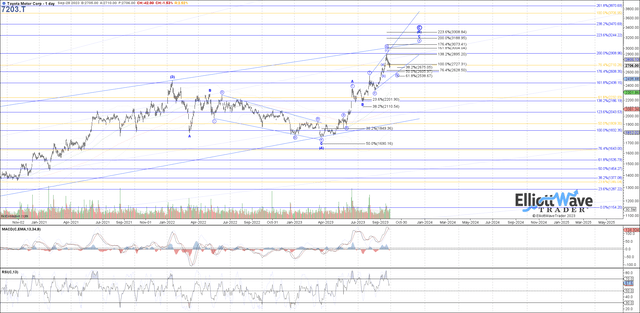
If you were following this chart from back in May then you will notice that price did not reach a substantially lower low but rather turned up and rallied more than 30%. This was something that we were keenly aware of as a possibility, and members were alerted back in mid-June that a more bullish outcome was becoming more probable.
Remember that markets are non-linear, fluid, and dynamic in nature, much like human behavior. Or, rather, exactly like human behavior. So where does this place us now?
As you can see on the latest chart, price should hold in this current area and turn up for one last rally phase to reach the 3000-plus level. It’s plausible to see price as already having struck an important high at the 2900 level. But support remains intact for the moment.
Risk: Should price move below 2400, that would be the first indication that 2900 is actually a more important high. And a move below 2100 would make that more likely.
Conclusion
The risk of Toyota becoming a value trap is rising. Once price completes this current rally structure, we will turn more defensive. What’s more, this may even provide a sell setup in the near future. For now, we will eye a higher high but remain vigilant should support give way.
There are many ways to analyze and track stocks and the market they form. Some are more consistent than others. For us, this method has proved the most reliable and keeps us on the right side of the trade much more often than not. Nothing is perfect in this world, but for those looking to open their eyes to a new universe of trading and investing, why not consider studying this further? It may just be one of the most illuminating projects you undertake.
(Housekeeping Matters)
If you would like notifications as to when our new articles are published, please hit the button at the bottom of the page to “Follow” us.
Read the full article here

 Q4 2025 Earnings Call Transcript")
")
")
")
")
")
")
