
 Q4 2025 Earnings Call Transcript")
")
")
")
There are growing fears that the government may have a tougher time paying its debt over the coming years. With an annual budget deficit near $1.5 trillion (from October 2022 to August 2023, per the Brookings Institute), and heavy Treasury issuance in recent weeks, there’s pressure across the curve amid rising interest rates. Over the last several weeks, a large supply of bills, notes, and bonds have been sold to help service debt and finance the bloated budget. Investors are not taking it well as the clouds are growing darker over how the nation will be able to pay its bills.
I have a hold rating on the iShares 20+ Year Treasury Bond Buywrite Strategy ETF (BATS:TLTW). I assert that the technical chart is simply too precarious right now to enter a long position in long-dated Treasuries, even with the income kicker that comes with selling upside calls on the long-bond ETF. With far-dated Treasuries now about 50% below their August 2020 highs, investors may be wondering if now’s the time to cautiously get long the far end of the rate curve. There are key macro risks to consider.
TLT: The Crash Reaches a 50% Drawdown
Koyfin Charts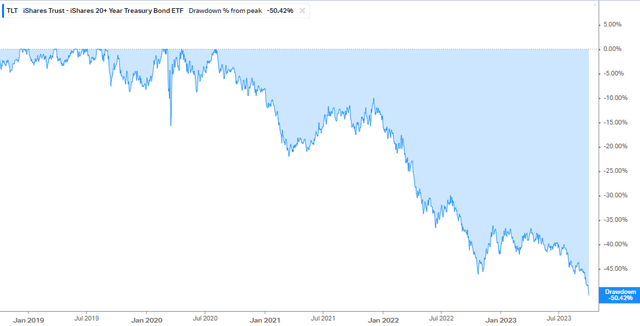
The Long-Bond Drawdown Now Exceeds the Bond ViSPX GFC Plunge
@JackFarley96, Top Down Charts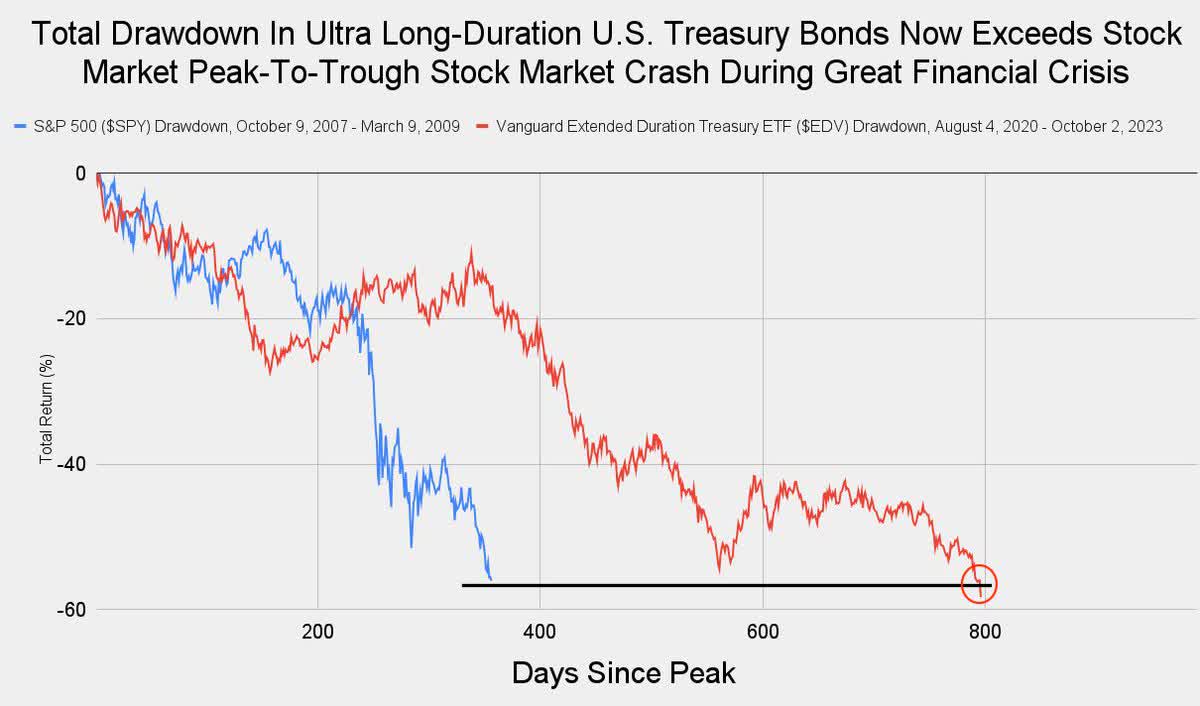
Bond Vigilantes Emerging
Bloomberg, Christophe Barruad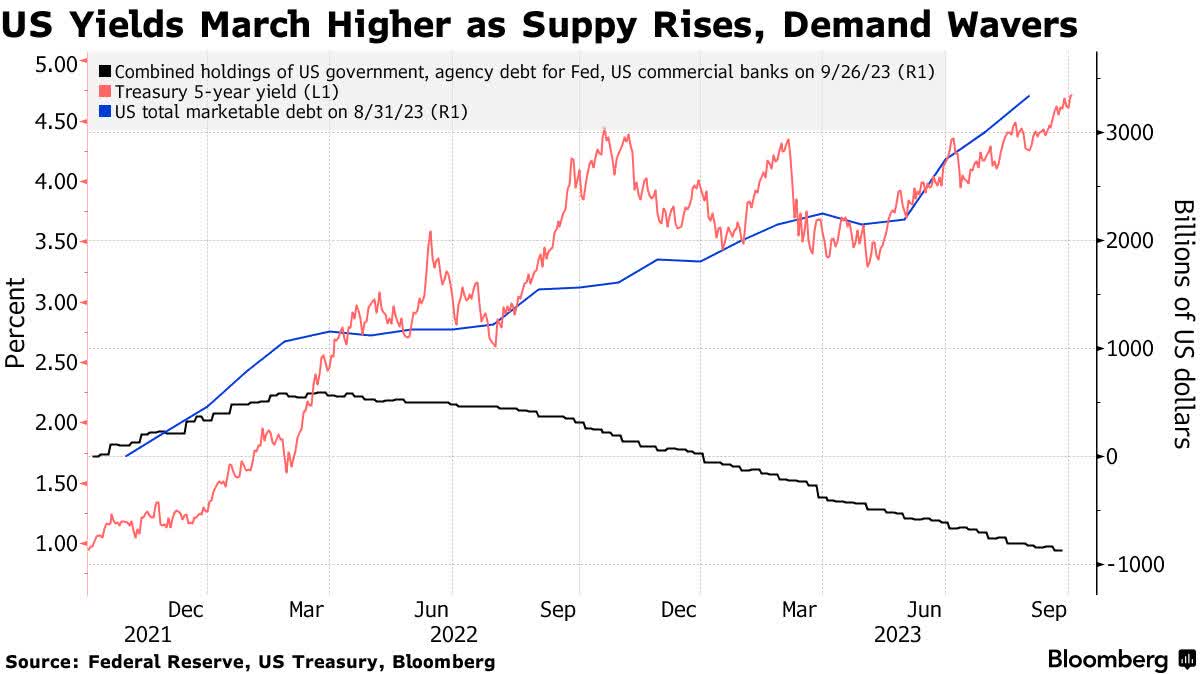
Heavy Near-Dated Bill Issuance Pressuring Federal Finances
St. Louis Federal Reserve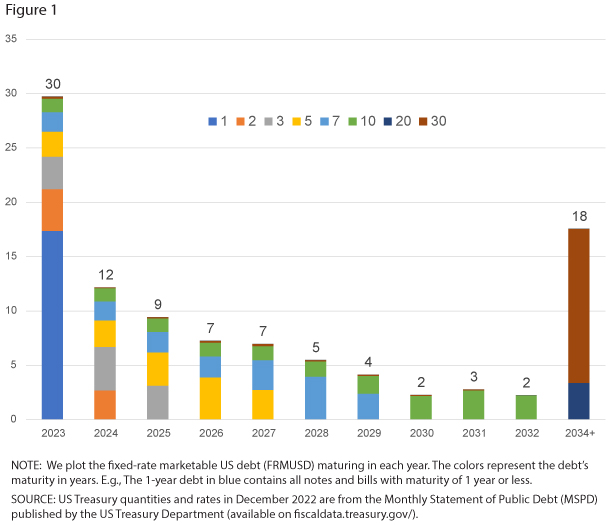
Goldman Sachs estimates that federal interest expense will soar from 2% of GDP in 2022 to 3% in 2024 and perhaps as high as 4% by 2030. That would eclipse the peak from the early 1990s – a time when deficits were also sizable and market rates were still coming down from highs seen in the early 1980s.
Growing Debt-Servicing Fears
Goldman Sachs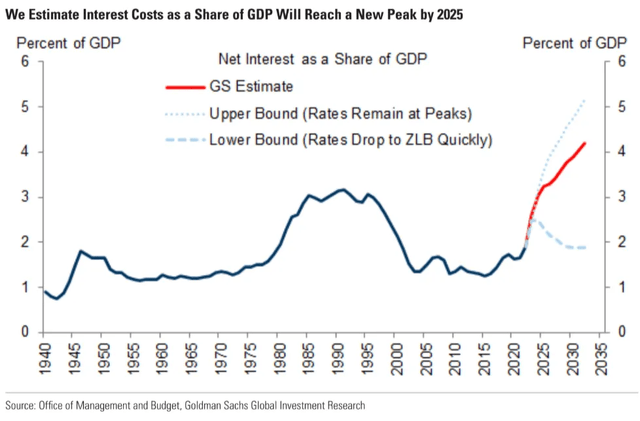
The US national debt has been increasing at a stunning rate lately, jumping to $33.4 trillion this month
Zero Hedge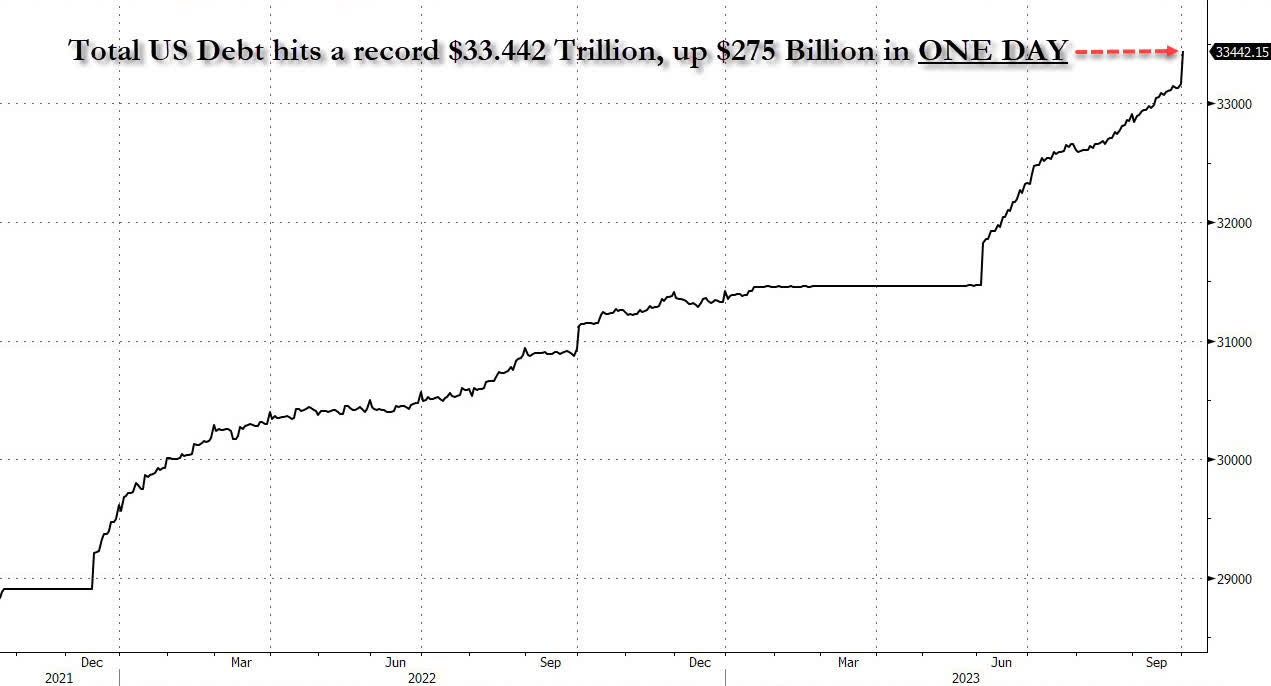
According to the issuer, TLTW seeks to track the investment results of an index that reflects a strategy of holding the iShares 20+ Year Treasury Bond ETF while writing (selling) one-month covered call options to generate income. It can generate higher income compared to simply owning a product like the iShares 20 Plus Year Treasury Bond ETF (TLT) through its buy-write strategy and buffers against pure losses on the Long Bond during periods of rising interest rates. Finally, with TLTW, there’s no need for the investor to go about the tedious and potentially complex process of selling calls and rolling options on their own.
The taxable bond ETF has seen growing interest as its assets under management have increased to $631 million despite the fund being down more than 20% since late July. The current trailing 12-month dividend yield is closing in on 20%. Importantly, right now, the implied volatility level on long-term Treasury bonds is at the highest level since March at 22%. A higher implied volatility percentage means more premium income collected through selling options.
TLT: Implied Volatility Jumps to Fresh 6-Month Highs
ORATS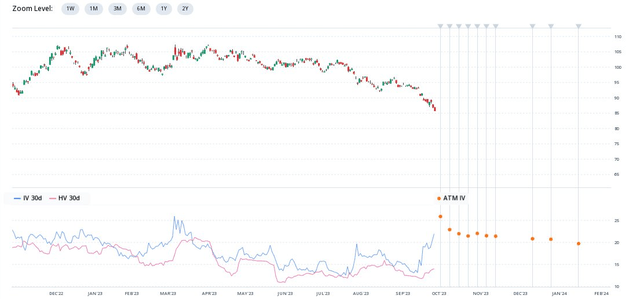
Compared to TLT, the buywrite strategy has sharply outperformed. So far on the year, TLT is down a steep 12.5% (dividends included) while TLTW is off slightly more than 5%. If you are looking to prudently get exposure to some of these higher rates, then TLTW could be a decent way to do it right now considering the much higher implied volatility level today.
TLTW features a modest net annual expense ratio of 0.35% and its liquidity rating is strong considering that the 30-day average volume is more than 450,000 and the median bid/ask spread is a mere three basis points. A key risk is rising interest rates – the fund’s effective duration is 16.2 years. That means for a 1% rise in yields, the fund’s net asset value would fall approximately 16.2%. TLTW is simple in what it holds: TLT as well as flex options on TLT at the $96 strike at the October 2023 expiration date (as of October 3, 2023).
TLTW: Fund Details & Dividend Information
Seeking Alpha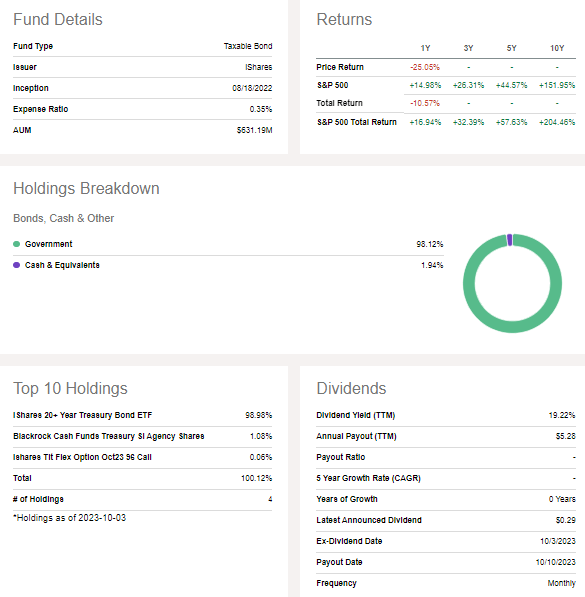
Seasonally, TLT tends to perform poorly from early October through mid-November, according to data from Equity Clock. So, this is a particularly precarious period on the calendar for 20+ year Treasury bonds and suggests investors proceed cautiously with a product like TLTW if you have a near-term time horizon.
TLT: Bearish Seasonal Trends Into Mid-November
Equity Clock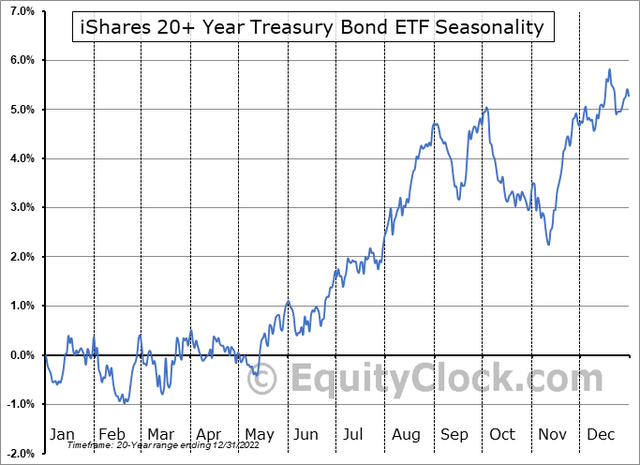
The Technical Take
With a covered call play like TLTW, investors want to see the underlying asset trade sideways or increase modestly. In the last few weeks, TLT has declined sharply, leading to principal losses being far greater than the income yield. While I assert that today’s higher implied volatility, along with a better yield to maturity on TLT, should benefit holders of TLTW through a bigger yield, TLT is a falling knife right now. If we take a look at the TLTW technical chart below, we find that there was a clear breach of support on August 1.
Now, there’s nuance to performing chart work on an extremely high-yield fund, but it’s also hard to argue with how important the $32 level was. TLTW’s nominal share price held that spot on several occasions from October 2022 through this past July. Today, both the fund’s long-term 200-day moving average and 50dma are negatively sloped and the RSI momentum indicator at the top of the graph is in deeply oversold territory. Even if we get a bounce, there is a high amount of volume by price in the $30 to $34 range, so that may be a natural area of potential supply on rally tries.
Overall, it is a bearish chart, and while a relief rally may come about, technical damage has been done.
TLTW: Downside Momentum, Resistance at $32
Stockcharts.com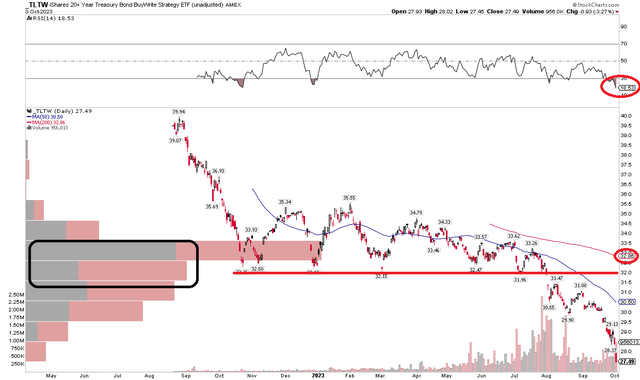
Lastly, investors are extremely short Treasuries right now. Deutsche Bank reports that short positions in US government bonds have hit new all-time highs, and snapback, short-covering rallies could be fierce in the near term.
A Bullish Short-Covering Rally Possible, Per DB
Deutsche Bank, Daily Chartbook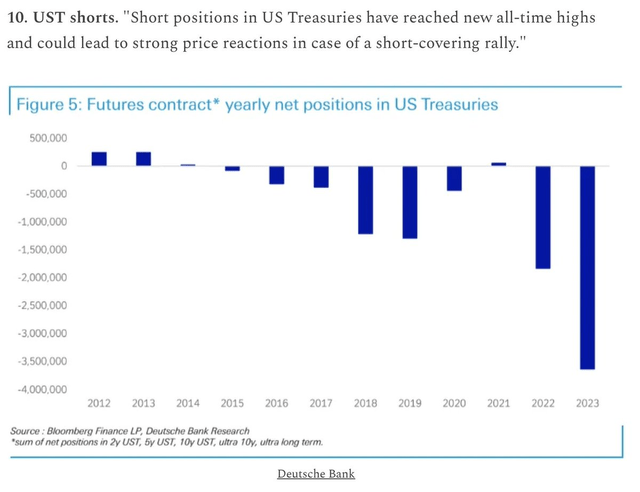
The Bottom Line
I have a hold rating on TLTW. Given high implied volatility levels and a YTM nearing 5% on TLT, there’s significant income potential with this buywrite strategy. Also, extreme investor positioning in Treasuries supports the case for a near-term rally, but seasonal patterns say otherwise. Amid these mixed signals, I would like to wait for TLT to calm down to help improve TLTW’s chart which is in a clear downtrend with high negative momentum.
Read the full article here
 Q4 2025 Earnings Call Transcript")
")
")
")
")
")
")
")

