
")
")
")
: Analysts’ Estimates Overly Optimistic (Maintain Strong Sell)")
Investment Thesis:
Background –
I last published an article on The Progressive Corporation (NYSE:PGR) back in November 2021, “The Progressive Corporation: Don’t Get Caught By Dividend Decrease”, and with a “Strong Sell” rating. Total yearly dividends were $2.81 for 2019, $2.55 for 2020, and $6.40 for 2021. Commencing 2022, total dividends reduced to $0.40 per year and have remained at that level, quite a reduction, and consistent with the article title. The company has also missed analysts’ quarterly EPS estimates for 5 of the last 7 quarters since the publication of my November 2021 article (the 5 misses total $0.82 per share and the 2 beats total $0.14 per share). Despite this the share price has increased by 50.05% since the date the article was published. This share price increase appears to have been driven purely by strong sentiment based on expected future EPS growth. This has resulted in the P/E multiple increasing from 20.43 at the time of preparation of the November 2021 article to its current level of 45.79. This multiple increase is despite the dividend rate being slashed and analysts’ consensus EPS estimates for 2023 decreasing from $5.64 back in November 2021 to current estimate of $4.79. Clearly, a 45.79 multiple is not justifiable unless there are justifiable expectations for much higher EPS levels in future years.
Progressive is a well-run business –
The Progressive Corporation appears to be a well-run business, generating solid growth. Being an insurance business, returns primarily derive from investment of premiums received in advance, while the insurance aspect is managed by careful pricing of risk in a competitive market, to achieve a balance between premiums received and risk taken on. The following excerpt from the Q2-2023 earnings call is of interest in this regard, and for anyone interested in Progressive stock, it is worth reading the whole of the transcript to better understand the risks involved and how Progressive manages them.
Catastrophe losses were a significant part of our profitability pressures. To date, 2023 has been a significant catastrophic year with some estimates suggesting that U.S. insurer losses have already surpassed $25 billion this year. The events this year had been broadly felt with 44 states affected by 43 events. At the company level, these events have added 4.5 points to our combined ratio year-to-date, which is 1.7 points higher than the impact catastrophe events had on our combined ratio for the first half of 2022. Our property business has been most affected by catastrophes, adding almost 46 points to the property loss ratio so far this year, which is about 16 points more when compared to this time in 2022.
A further excerpt from the Q4-2022 earnings call is illuminating in relation to how Progressive is managing risk for automobile insurance.
As I said in my annual shareholders letter, segmentation is a key facet of our competitive prices pillar, and nowhere is that more evident than in our investment in usage-based insurance products, which will be the topic of today’s presentation. Progressive was a first mover in usage-based insurance. We have had a UBI offering since 1996 when we launched our first product called Autograph. This first effort was limited by the technology at the time and required a professional mechanic to install equipment in a customer’s car at a considerable expense.
Once again it is worth reading this whole section of the transcript. I find it fascinating that Progressive now has the capability to not only monitor and base premiums on usage (e.g. miles driven), but even has the capability to detect the occurrence of an accident for an insured vehicle and to dispatch emergency help and tow truck assistance.
Summary and Conclusions –
Clearly, Progressive is a well-run and highly innovative business, and I applaud them for that. But it does not change my view that the stock is overpriced with a current P/E multiple of 45.79 and the possibility risk is not adequately allowed for in SA Premium analysts’ consensus EPS estimates out to 2025. Even if analysts’ consensus EPS estimates are met, reduction of multiple from the present 45.79 level can be expected, and this might limit further increases in share price. I maintain a Strong Sell rating on Progressive stock. A more detailed financial analysis in support of this rating follows.
Financial Analysis and Comment
Looking for market mispricing of stocks –
What I’m primarily looking for here are instances of market mispricing of stocks due to distortions to many of the usual statistics used for screening stocks for buy/hold/sell decisions. I believe the answer is to compare projections, based on analysts’ estimates out to the end of 2024 or later, to past performance. Summarized in Tables 1 and 2 below are the results of compiling and analyzing the data on this basis.
Table 1 – Detailed Financial History And Projections
Seeking Alpha Premium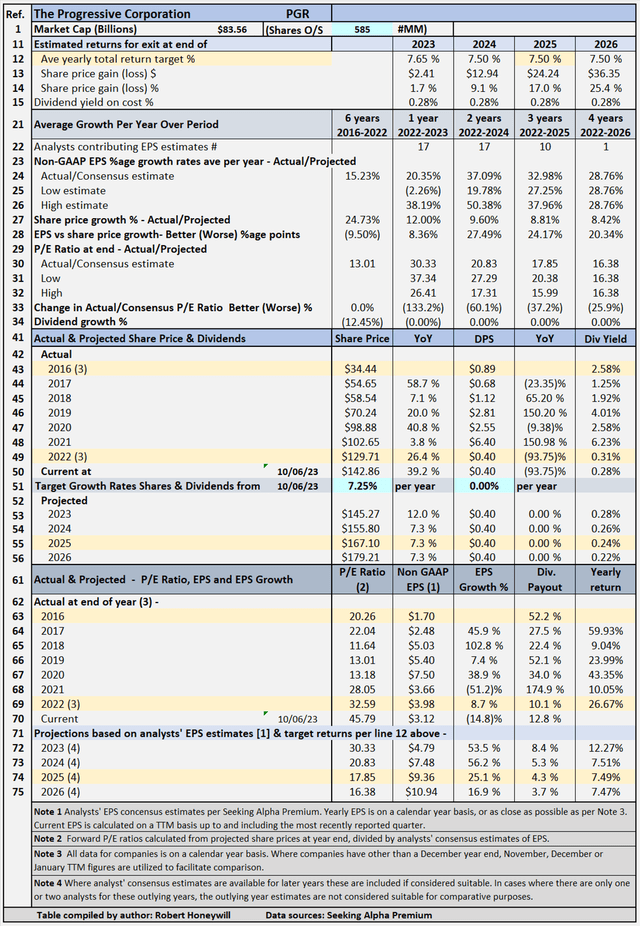
Table 1 documents historical data from 2016 to 2022, including share prices, P/E ratios, EPS and DPS, and EPS and DPS growth rates. The table shows EPS grew strongly, at an average rate of 15.23% per year, between 2016 and 2022. This obviously created strong sentiment toward the stock, and the share price grew at an ever faster rate of 24.73% per year between 2016 and end of 2022. The table also includes estimates out to 2026 for share prices, P/E ratios, EPS and DPS, and EPS and DPS growth rates. (Note – while estimates are shown for analysts’ EPS estimates out to 2023 to 2026 where available, estimates do tend to become less reliable, the further out the estimates go. These estimates are only considered sufficiently reliable if there are at least three analysts’ contributing estimates for the year in question). Based on analysts’ consensus EPS estimates, EPS is projected to continue to grow at a high rate of 32.98% per year through end of 2025. Table 1 allows modeling for target total rates of return. In the case shown above, the target set for total rate of return is 7.5% per year through the end of 2025 (see line 12), based on buying at the Oct. 6, 2023, closing share price level. As noted above, estimates become less reliable in the later years. I have decided to input a target return based on the 2025 year, which has EPS estimates from ten analysts because it allows for the impact of the projected EPS growth rates to be taken into account in the assessment of the value of Progressive shares. The table shows to achieve the 7.5% return, the required average yearly share price growth rate from Oct 6, 2023 through Dec. 31, 2025, is 7.25% (line 51). Dividends and dividend growth account for the balance of the target 7.5% total return.
Progressive’s Projected Returns Based On Selected Historical P/E Ratios Through The End Of 2025
Table 2 below provides scenarios projecting potential returns based on select historical P/E ratios and analysts’ consensus, low, and high EPS estimates per Seeking Alpha Premium through the end of 2025.
Table 2 – Summary of relevant projections Progressive
Seeking Alpha Premium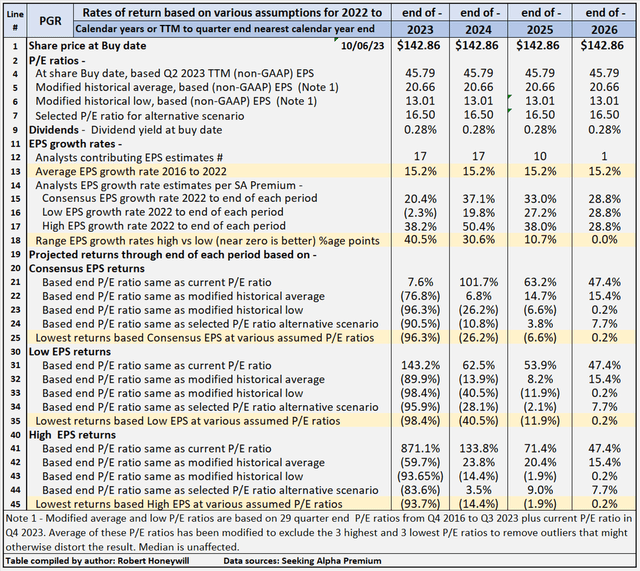
Table 2 provides comparative data for buying at closing share price on Oct. 6, 2023, and holding through the end of years 2023 through 2026. There’s a total of twelve valuation scenarios for each year, comprised of three EPS estimates (SA Premium analysts’ consensus, low and high) across three different P/E ratio estimates, based on historical data, plus a fourth P/E ratio selected to provide an alternative scenario. Progressive’s P/E ratio is presently 45.79, which is far above the historical average P/E ratio of 20.66. Table 2 shows potential returns from an investment in shares of the company across the range of P/E ratios This analysis, from hereon, assumes an investor buying Progressive shares today would be prepared to hold through 2025, if necessary, to achieve their return objectives. Comments on contents of Table 2, for the period to 2025 column follow.
Consensus, low and high EPS estimates
All EPS estimates are based on analysts’ consensus, low and high estimates per SA Premium. This is designed to provide a range of valuation estimates – from low to most likely to high – based on analysts’ assessments. I could generate my own estimates, but these would likely fall within the same range and would not add to the value of the exercise. This is particularly so in respect of well-established businesses such as Progressive. I believe the “low” estimates should be considered important. It’s prudent to manage risk by knowing the potential worst-case scenarios from whatever cause.
Alternative P/E ratios utilized in scenarios
- The actual P/E ratios at the share buy date are based on actual non-GAAP EPS for Q2-2023 TTM.
- A modified average P/E ratio based on 29 quarter-end P/E ratios from Q4 2016 to Q3 2023 and current P/E ratio in Q4 2023. The Q3 and Q4 2023 P/E ratios are based on share price at the end of Q3 2023 and the current share price in Q$ divided by TTM EPS for latest reported earnings through end of Q2 2023. The average of these P/E ratios has been modified to exclude the three highest and three lowest to remove outliers that might otherwise distort the result.
- A modified low P/E ratio was calculated using the same data set used for calculating the modified average P/E ratio, and calculated on a similar basis, with the three highest and lowest P/E ratios excluded.
- A median P/E ratio is calculated using the same data set used for calculating the modified average P/E ratio. Of course, the median is the same whether or not the three highest and lowest P/E ratios are excluded. In the case of Progressive, I have chosen to use an assumed P/E ratio of 16.5 in place of the historical median of 19.07 (similar to the average). I have done this to provide an idea of the impact on returns of the multiple declining significantly below the present level and the historical average. The selected P/E multiple of 16.5 compares to the sector median of 8.87 for PE Non-GAAP [FWD], per Seeking Alpha Premium metrics.
Reliability of EPS estimates (line 18)
Line 18 shows the range between high and low EPS estimates. The wider the range, the greater disagreement there is between the most optimistic and the most pessimistic analysts, which tends to suggest greater uncertainty in the estimates. There are ten analysts covering Progressive through the end of 2025. In my experience, a range of 10.7 percentage points difference in EPS growth estimates among analysts is high and suggests a fairly high degree of uncertainty, and thus reduced reliability.
Projected Returns (lines 19 to 45)
Lines 25, 35, and 45 show at a range of historical P/E ratio levels, Progressive is conservatively indicated to return between negative (11.9)% and negative (1.9)% average per year through the end of 2025. The negative (11.9)% return is based on analysts’ low EPS estimates and the negative (1.9)% on their high EPS estimates, with a negative (6.6)% return based on consensus estimates. Those are the lowest of the returns under the consensus, low, and high EPS scenarios and assume a P/E multiple at Progressive’s historical low multiple of 13.01. At Progressive’s historical average P/E multiple of 20.66, the indicative returns range from 8.2% to 20.4%, with consensus of 14.7%. Those indicative returns, based on historical average multiples might appear encouraging. But as explained further below, the analysts’ consensus EPS estimates on which they are based, could well be overly optimistic in the light of past experience. Also, Progressive’s multiple is far above its sector median and a better measure might be Progressive’s average multiple of ~16.5 over the three years 2017 to 2019 inclusive. Table 2 shows applying a 16.5 multiple to analysts’ EPS estimates gives indicative returns ranging from a low of negative (2.9)% to a high of 9.0%, with consensus of 3.8%. Even those much lower returns could be overstated if past over-optimism, as shown in Table 3 below, is also reflected in analysts’ current EPS estimates.
Table 3
Seeking Alpha Premium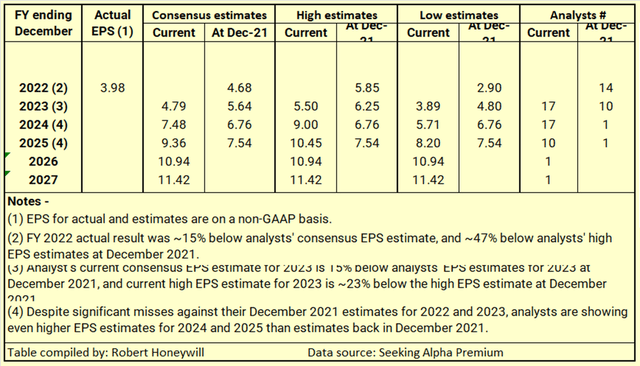
What is concerning here is at a multiple of 16.5 at the end of 2025, indicative return based on analysts’ current consensus EPS estimate for 2025 is only 3.8%. Analysts’ consensus EPS estimate for 2025 of $9.36, on which the 3.8% return is based, is almost double the current consensus EPS estimate for 2023. Given the history of analysts overestimating EPS for Progressive, the 3.8% indicative return could easily turn negative if current EPS estimates are not met.
Checking Progressive’s “Equity Bucket”
Table 4.1 Progressive Balance Sheet – Summary Format
Seeking Alpha Premium and SEC filings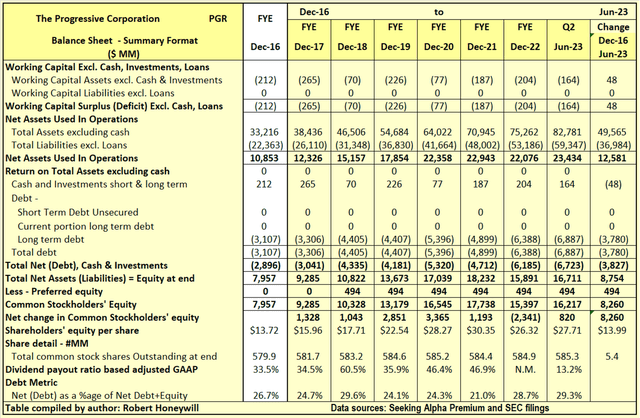
Over the 6.5 years from the end of 2016 to the end of Q2-2023, Progressive’s Net Assets Used In Operations increased by $12,581 million. This increase of $12,581 million was funded by an increase of $3,827 million in debt net of cash, preferred stock issue raising $494 million, and an increase of $8,260 million in common stock shareholders’ equity. Net debt as a percentage of net debt plus equity increased from 26.7% at the end of 2016 to 29.3% at the end of Q2-2023. Outstanding shares increased by 5.4 million from 579.9 million to 585.3 million, over the period, due to shares issued for stock compensation partially offset by share repurchases. The $8,260 million increase in shareholders’ equity over the last 6.5 years is analyzed in Table 4.2 below.
Table 4.2 Progressive Balance Sheet – Equity Section
Seeking Alpha Premium and SEC filings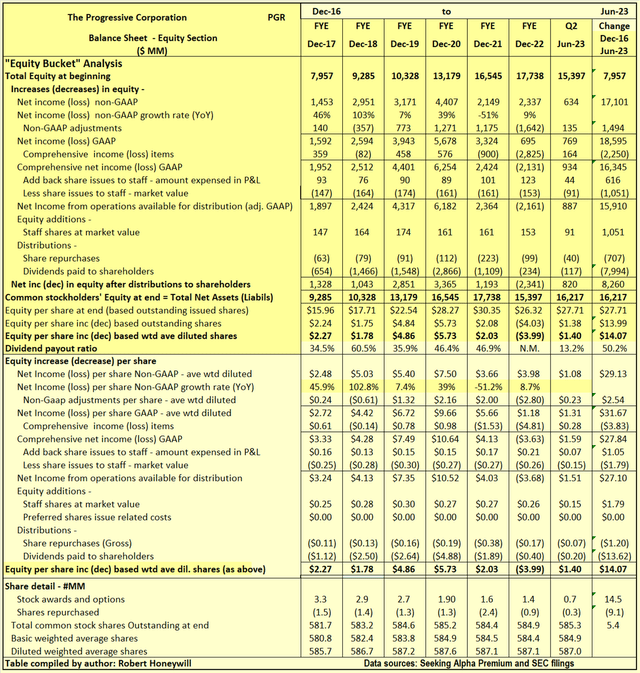
I often find companies report earnings that should flow into and increase shareholders’ equity. But often the increase in shareholders’ equity does not materialize. Also, there can be distributions out of equity that do not benefit shareholders. Hence, the term “leaky equity bucket.” I look for evidence of this in my analysis of changes in shareholders’ equity.
Explanatory comments on Table 4.2 for the period end FY-2016 to end Q2-2023.
- Reported net income (non-GAAP) over the 6.5-year period totals $17,101 million, equivalent to diluted net income per share of $29.13.
- Over the 6.5-year period, the non-GAAP net income excludes a significant $1,494 million of net income items, which are included in arriving at GAAP net income. GAAP net income excludes $2,250 million of losses which are included in comprehensive income. The magnitude of these items relates largely to the accounting requirements for insurance companies.
- Amount taken up in equity to account for shares issued to staff over the 6.5 years is $616 million. This compares to an estimated market value of $1,051 million at the time of issue for these shares. The difference of $435 million is not material in the context of Progressive’s earnings.
- By the time we take the above-mentioned items into account, we find, over the 6.5-year period, the reported non-GAAP EPS of $29.13 ($17,101 million) has decreased to $27.10 ($15,910million), increase in funds from operations available for distribution to shareholders.
- Dividends of $7,994 million, and share repurchases of $707 million were easily covered by the $15,910 million from operations, leaving a net increase in equity from operations of $7,209 million.
- Equity issues to staff of $1,051 million increased the $7,209 million surplus from operations to the $8,260 million increase in shareholders’ funds per Table 4.1 above.
Progressive: Summary and Conclusions
Shareholder returns for Progressive over the last few years have come mainly from share price increases. Share price increases have resulted from a combination of high EPS growth and multiple expansion. Multiple expansion has resulted from share price growth rates far exceeding EPS growth rates. There has to be a question mark over whether this imbalance can be maintained. There also has to be a question mark over whether analysts’ EPS estimates out to 2025 can be met, given past misses. On the balance of probabilities, it is believed the effect of multiple contraction will likely exceed the effect of EPS growth over the next couple of years, resulting in negligible or negative share price change. No matter how well-run a business is, it is possible to pay too high a price for its stock. A strong sell rating is maintained for Progressive stock.
Read the full article here
")
")
")
")
")
")
")

 Q4 2025 Earnings Call Transcript")
