
")
")
")

This article provides an impact assessment of the FOMC October meeting and a possible rise in the Federal Funds Rate to 5.75% from 5.5%
The chart below shows the current FFR situation.
Trading Economics dot com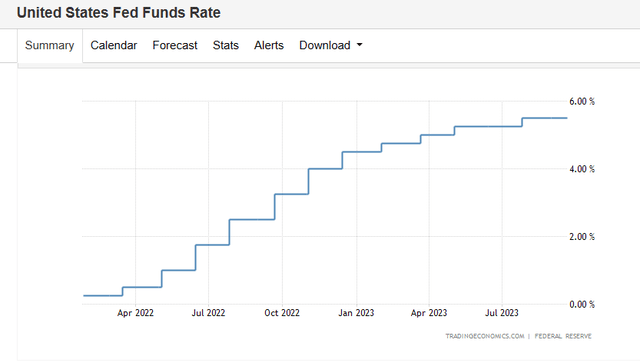
The Federal Reserve raised the target range for the Federal Funds Rate to 5.5% at its August 2023 meeting in what has been an almost nonstop staircase of rate rises since they began in March 2023: From 0.25% to 5.5% in just over one year.
Most likely the new upper limit target range will be 5.75% with adjustment to other rates as well such as the prime rate and Interest on Reserves Balances. Continued QT bond selling will roll on.
Mr Robert P Balan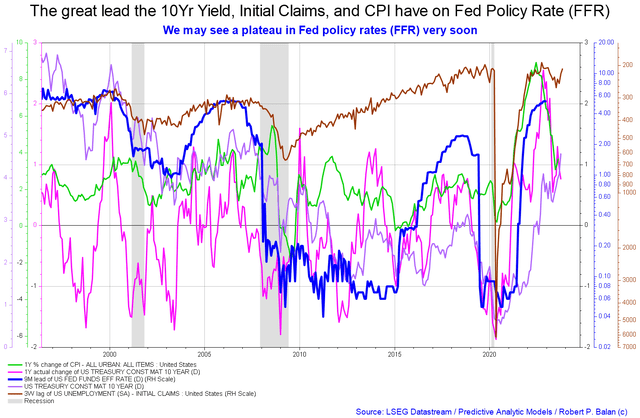
The chart above from Mr. Robert P. Balan shows the lead of the 10-year yield (long end of the yield curve), initial claims, and the CPI on the FFR (short end of the yield curve). The FFR is led nine months in advance by those over factors, and given that they have fallen recently from their high levels, they could lead the FFR downwards.
This change over last month is that the 10-year bond yield has risen a little. This gives the Fed space to make another rate rise without causing an inversion of the yield curve whereby short-term rates exceed long-term rates which tends to upend the financial industry that trades on this margin when it’s positive and lose money when it’s negative.
This chart shown last month proved to be relatively predictive in that it shows the factors that drive Fed decisions are pointing to a cessation or downward trajectory for interest rates and at the last meeting the Fed did indeed hold rates where they were.
One must remember that while the other driving factors are dynamic and driven by market forces, the FFR is driven solely by a committee of people making a binary up-and-down decision based on emotion and politics rather than rational inputs.
A campaign of rising interest rates is the method by which assets are transferred to the creditor class from the debtor class via a sweating-out process of ever-higher rates leading to bankruptcy, foreclosures, and fire sales at knockdown prices. This process only stops when a crisis occurs and so far none has occurred apart from the early weak victims, such as the series of Silicon Valley banks with links to the cryptocurrency, that went bankrupt earlier this year — following the playbook their assets were taken over by obliging larger banks at knockdown prices. They were sweated out.
ANG Traders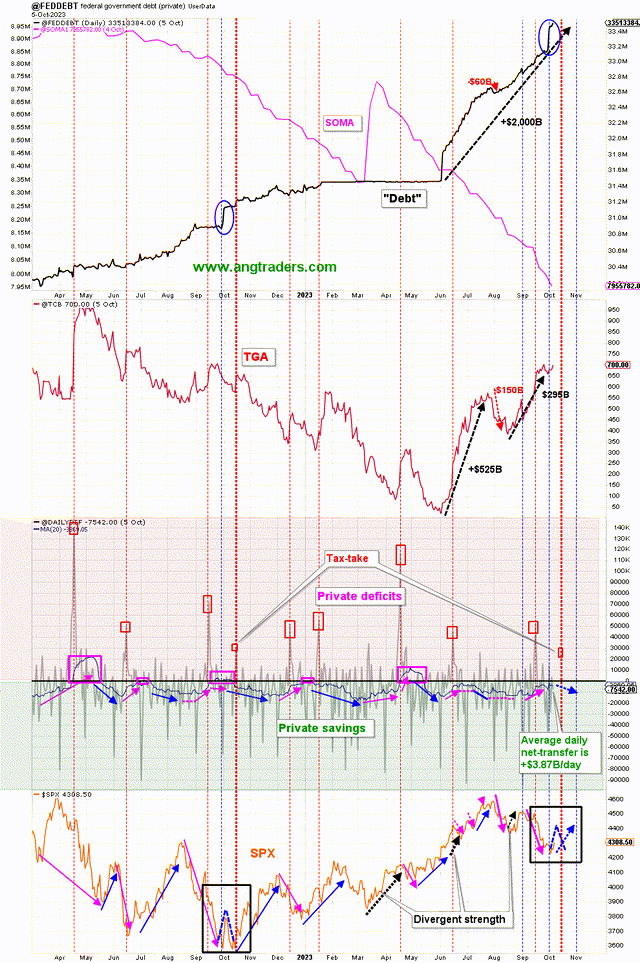
The chart above (top panel) plots how the Fed’s balance sheet (SOMA line in purple) has steadily fallen as it maintains its program of bond selling. Also shown in the same panel is the growth of the stock of Treasuries also known as the national debt and in reality the money supply. Selling bonds from the SOMA account removes money from the private sector and moves it to the government sector in exchange for Treasuries and the macro effect is to reduce overall financial liquidity in the private sector. The abundance of Treasuries in the macro drives up the longer end of the yield curve at the same time as the shorter end is driven up by man-made policy decisions.
Doing QT at the same time as increasing the FFR is a subtle form of yield curve control.
A movement of the FFR has four broad impacts:
- Bank lending costs on required reserves.
- The interest burden on private debt.
- The interest on newly issued Treasury deposits.
- Interest is paid on reserve and REPO balances which is where the prime rate is applied.
These four impacts are looked at in turn.
The table below shows the impact of rates on bank reserves advanced by the Fed, via the discount window, when a bank makes a loan. Or what it pays to other banks to borrow their excess reserves.
US Treasury and author calculations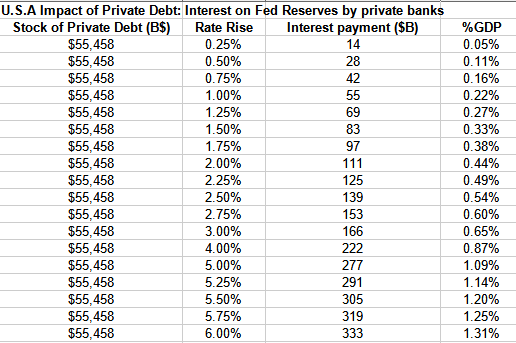
The interbank rate is shown in the chart below and shows that the Fed’s FFR maintenance efforts are working in that the rate is at the upper end of its target range. It’s unlikely that a commercial bank would have to use the Fed’s discount window to obtain funds given there are excess reserves in the system and that the SOFR rate is the same or less than the Fed rate.
Trading Economics dot com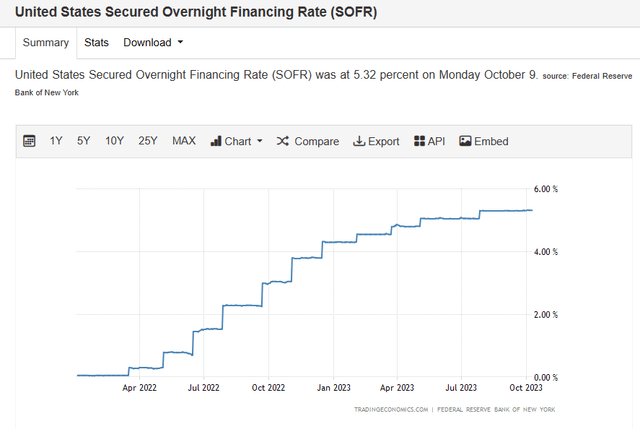
Every 0.25% rate movement changes the cost of loan funds by $14 billion. The private banks then pass on this rate change to the customer if they can. Most likely the rate will go up at the next meeting and banks would then pay $14 billion more for their bank reserves. This is 1.25% of GDP and about 21 times the amount in March 2022 when rates were at 0.25%. That’s a big adjustment to make in such a short term.
The next aspect is the interest burden on private debt.
The following table shows the impact of the FFR on the stock of private debt in absolute terms and as a percentage of GDP.
US Treasury and author calculations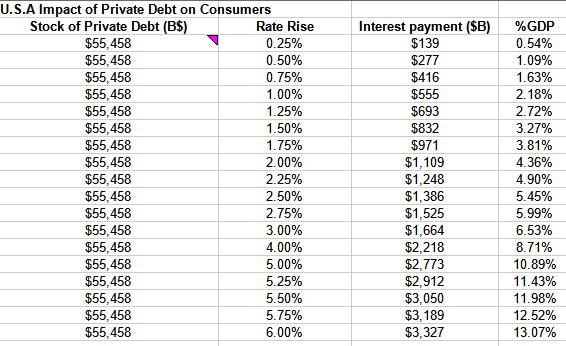
The chart shows that with each 0.25% FFR change, $139 billion, or 0.54% of GDP, is transferred from the household and business sector to the finance sector in a macro intersectoral income transfer, or vice versa. There’s no net new money being created here, it’s simply a movement of funds from one sector of the economy to another.
At present, just over 11% of GDP goes to banks as interest on loans. Debt drags on the real economy. A rate rise to 5.75% will cause the intersectoral funds flow to increase to 12.52% of GDP. An increase in living and business costs that have no counterpart in a real cost of production.
While the interest rate on private debt is rising, the stock of loans has not risen and bank credit in aggregate has fallen since January this year, as the chart below shows.
ANG Traders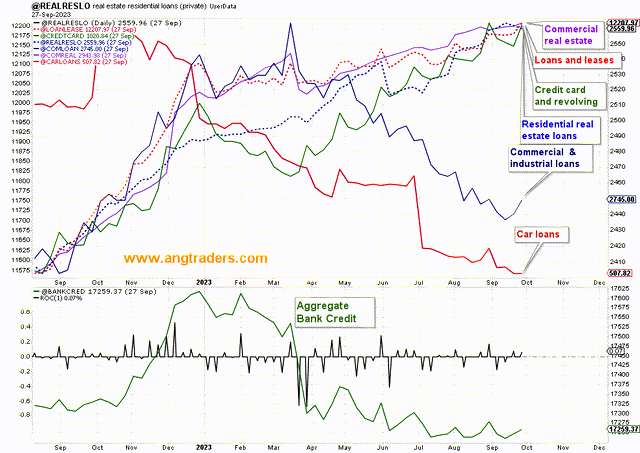
Despite the lack of aggregate bank credit growth, bank interest income has grown and does grow in tandem with the FFR as the chart below shows.
FRED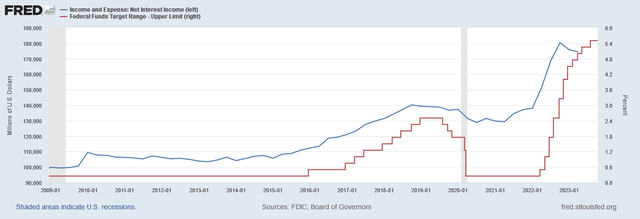
Treasury deposits are the next area of impact from a change in the FFR.
The following table shows the generalized impact of the rate change on the stock of Treasuries.
US Treasury and author calculations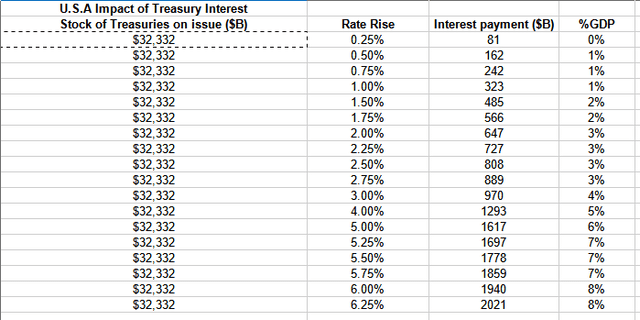
(Source: Author calculations based on Trading Economics Government Debt measure)
The table above shows that with each 0.25% rate change, a flow of $81 billion occurs either into or out of the economy.
An FFR increase means that the economy receives $81B more each year by way of interest payments from the federal government to bondholders. Overall this is a net gain of income to the economy given that the federal government is a net payer of interest and the currency creator via its central bank.
The Balance website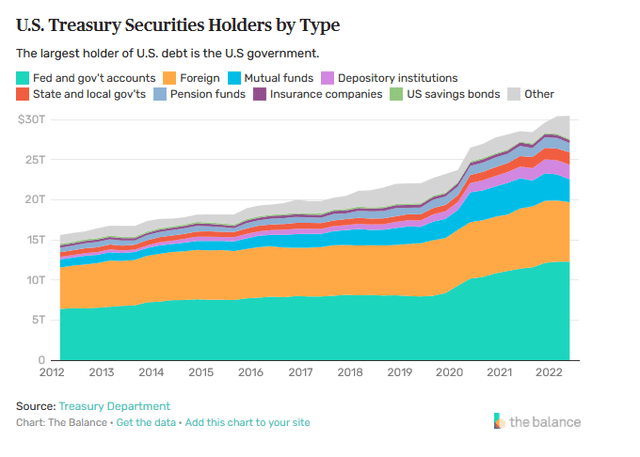
Not all of this Treasury bond interest income makes it into the private domestic sector. The chart above shows the ownership of the stock of Treasuries. The green area shows that about $12T is owned by the government itself and so the treasury interest income is circular in that it flows back to its origin and stays in the government sector.
$7.3T is owned by foreigners and so the interest income flows back to those owners as reserve deposits in their account at the Fed and at the macro level are in turn re-deposited into higher earning Treasury accounts. This is just like your account at a normal commercial bank, the money moves from checking to saving and then back again until spent out into someone else’s account. The main point though is that this money does not enter the domestic US economy, it stays in the external sector.
The income that does enter the US private domestic sector and the real economy is the interest on the remaining $10.86T that’s held by US mutual funds, banks, state and local governments, pension funds, and the like. This is about one-third of the total of the interest income, or about $618B.
The fourth and last impact of a change in the FFR is the mutual adjustment of interest on reserve balances and REPO balances.
FRED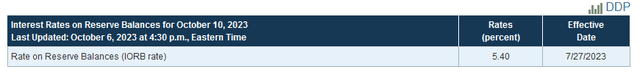
Each time the FFR rises or falls, the IORB is set to just underneath it. Most likely, an increase in the FFR will lead to a rise in the support rate to 5.65%. Such a change will add approximately a further $17.46 billion of money to the economy.
The probable changes to the IORB are summarized in the table below, remembering that the stock of reserves changes from day to day.
US Treasury and author calculations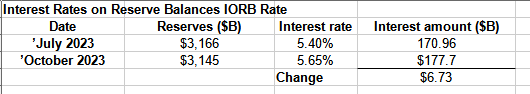
Since the Fed has started paying interest on reserves and lifting the rate in tandem with the FFR it has sent a large amount of income into the banking sector.
Now that the Fed pays interest to the banks on their reserve balances out of its income from operations, its cost of operations vastly outweighs its income from those operations. The Fed now transfers nothing to the US Treasury each year and is building up a negative balance on its accounts.
For practical purposes, the effect is that this is simply money creation that flows directly to the banking sector. The following chart shows the growth of the deferred asset. I wish my bank manager would treat my bank overdraft as an asset to my credit and not charge interest on it!
FRED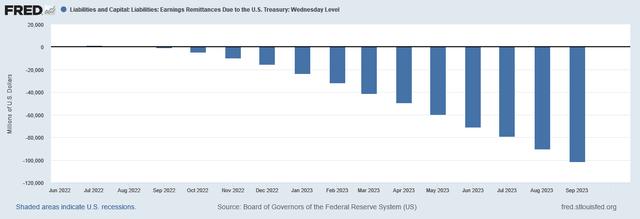
In September more than $11B flowed to the banking sector as interest on reserves. This number will increase as the IORB is raised. At that rate, it makes for an annual remittance to the banking sector of somewhere in the region of 12 x 11B = $132B.
The final impact is the effect on repurchase agreements (REPOs). The result of this change is shown in the table below.
US Treasury and author calculations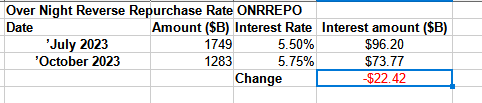
The result is that the banking sector is receiving an income stream from the Fed of some $73B per annum from this source. It’s less this month as compared to the level in July because the stock of REPOs has fallen.
This addition of income increases the bank’s capital base, which, in turn, means it can extend more loans given that banks are only constrained by their capital and the pool of creditworthy customers who wish to have a loan.
There are winners and losers from changes in the Fed policy rate, and these can be assessed in terms of key actors in the credit markets.
Banks: On the one hand, banks pay more for their borrowed reserves from the Fed, or other banks, when they make a loan. The interbank rate also is higher but is an intersectoral transfer only.
Banks slowly devour a larger and larger share of Gross Domestic Income – GDI – with each rate rise for no additional effort and no actual production of a good or service. A higher rate increases this process. Even though this income is then used in the national accounts to calculate GDP for the year no actual production of a real good or service took place. So even as the economy wallows in debt drag the interest burden is treated as having added to GDP.
Bank stocks can be expected to rise due to the increased income from:
- Increased loan interest from households and businesses on the existing loan book of over 217% of GDP.
- Interest on treasuries bought in exchange for excess reserves by the Federal Reserve goes up. Reducing the Fed’s balance sheet of Treasuries adds the interest income from those treasuries to the private sector whose rate also rises.
- Interest paid on reserves and REPOs by the Fed to the banks goes up and the free lunch becomes greater.
One could look at going long the big banks.
Borrowers: They suffer when rates rise and benefit when they fall. Borrowers in the household and business sectors get slowly squeezed with each rate rise. More and more income is devoted to debt service, and the appetite for more debt is reduced. Whatever income flows to banks as debt service payment detracts from aggregate demand for real goods and services.
Macro-economy: Gains income overall when rates rise and loses it when rates go lower due mainly to the size of the stock of Treasuries. The following table sets out a summary of the before and after effects of the rate change.
US Treasury and author calculations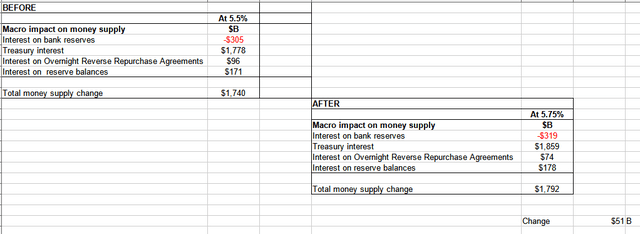
The net change to the money supply is $51B and expansionary overall and grows the economy. One must remember that Treasury income generally goes to people who already have a lot of money and are most likely going to invest the additional income in more paper assets rather than real assets. Even though real economic activity is weakening expect to see the price and turnover and demand for trophy assets such as art, luxury cars and boats, top-end real estate, rare wines, etc., to rise and be in greater demand.
The interest income to the private sector from Treasuries dwarfs all other considerations and is getting on for $2T per year. This shows the folly of monetary economics over Keynesian fiscal economics. Remembering that only about one-third of this amount enters the US domestic economy.
The federal government has limited fiscal space within which to spend its money into existence in a fashion that is both effective and non-inflationary. Being committed at the outset to spending $2T of your annual budget on interest on the money supply is a big loss to your fiscal space and forces you to cut back on more important areas such as health, education, and infrastructure.
This highlights the folly of issuing debt when money is created. One reaches a point where the federal government budget has a disproportionately large allocation to Treasury interest payments that would not be there otherwise. The solution is to stop issuing debt to match money creation as this is a leftover practice from the days of the long-dead gold standard style of national accounting. The solution is “green backing” where dollars are created and left as reserves in the system instead of being drained out into a savings Treasury bond. As long as there is a support policy rate in place the result is the same.
Read the full article here
")
")
")
")
")
")
")

 Q4 2025 Earnings Call Transcript")
