


")
")
Last month here, I wrote an article on the budding potential for a turnaround in REITs by early 2024, especially the intensely hated office building group (on work-from-home transition fears, compounded by rising interest rates). Right on cue, a rapid increase in pricing for the real estate sector has played out since late October. This past week’s jump may have pinpointed another bottom, at least over the short term, in many individual names like City Office REIT (NYSE:CIO). I mentioned CIO in my original article as having strong odds of a rebound in investor interest next year.
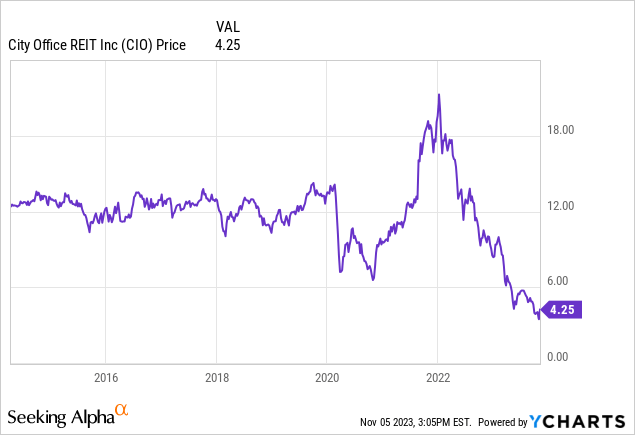
YCharts – City Office, Weekly Price Since 2014
Several new technical trading developments for CIO have me thinking a final bottom in the trust quote has been reached or will happen on one last capitulation move in the coming weeks. As a consequence, I thought I would write a longer explanation of what I was thinking.
What’s the upside? Given a nearly complete vacuum of sellers over recent sessions, the supply/demand setup for City Office (and many office REITs) could easily allow a DOUBLE or more in price over 6-12 months during a now fully-discounted recession scenario. In addition, the appearance of “unexpected” good news like a drop in interest rates and/or the continuation of decent economic growth in the U.S. economy, may support a TRIPLE or more in price by the end of 2024, similar to the major rebound years of 2009-10 out of the Great Recession.
The Business
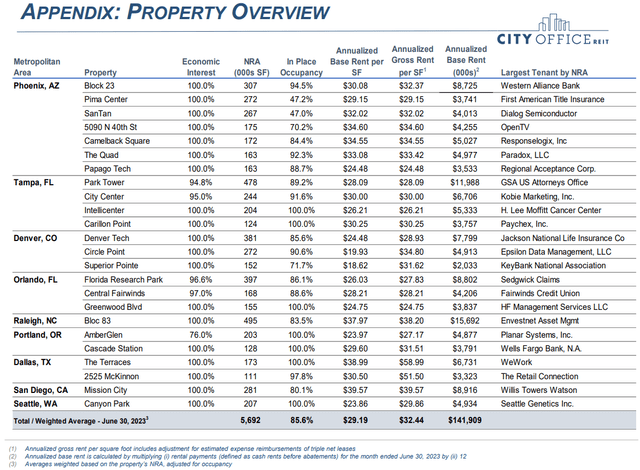
City Office owns mostly newer or updated office buildings concentrated in the Sun Belt states of the U.S. This area of the country has been witnessing better economic growth on rising migration trends from other parts of the country. The demographic backdrop is above average in my view vs. many competing REITs for your investment dollar.
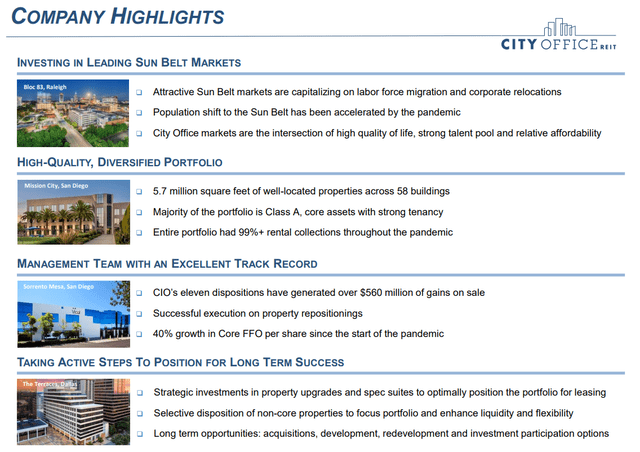
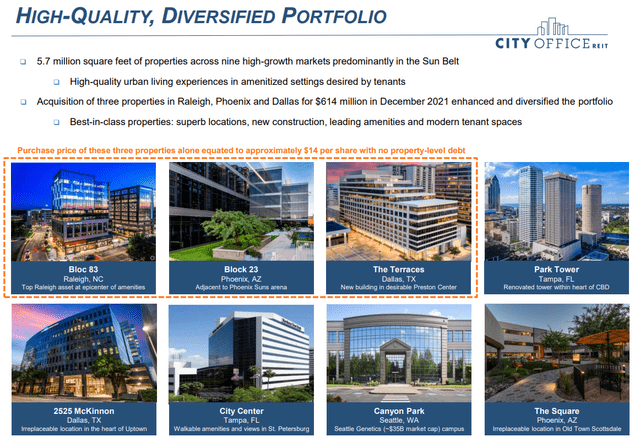
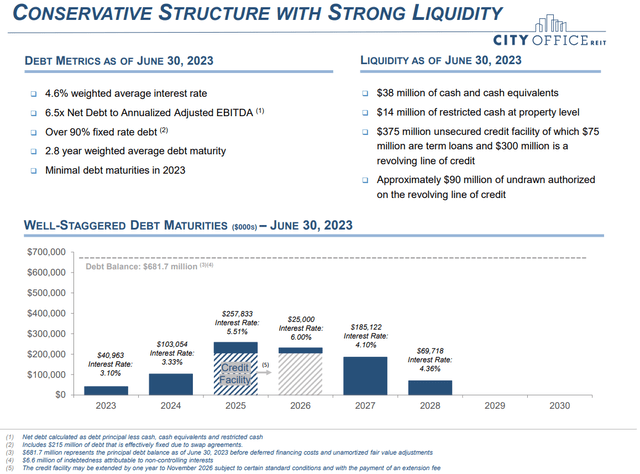
Little debt is due for the rest of 2023 and all of 2024, with a fixed-cost structure through past bond offerings and hedges on its remaining borrowed balances. A summary of the business below comes from the company’s August investor presentation. Really, analyst/investor hoopla that all office buildings are dead money forever is not consistent with high occupancies, fixed-rate debts, robust cash flows, and an ability to sell individual buildings to raise cash if needed by larger REIT organizations. While I do agree the office building marketplace will see less demand for a few years, from the transition to greater work-from-home options, trends after that are pure guesswork (past 2025-26).
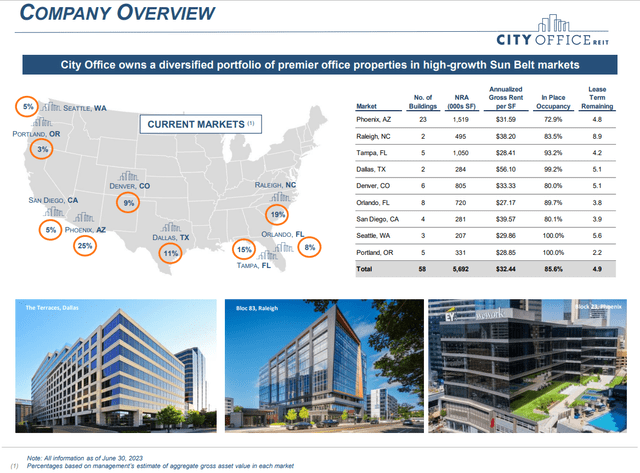
City Office – August Investor Presentation
City Office – August Investor Presentation
City Office – August Investor Presentation
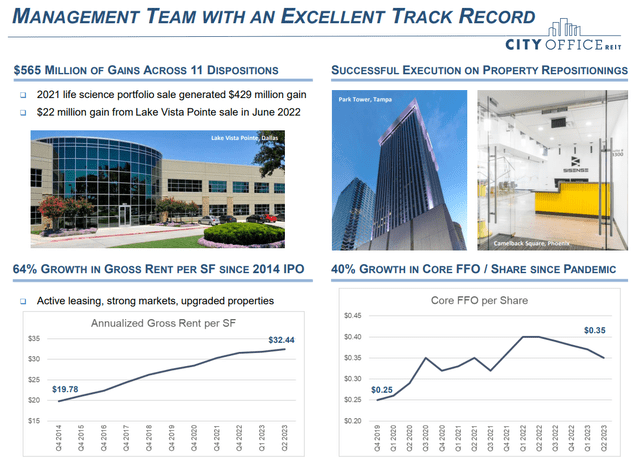
City Office – August Investor Presentation
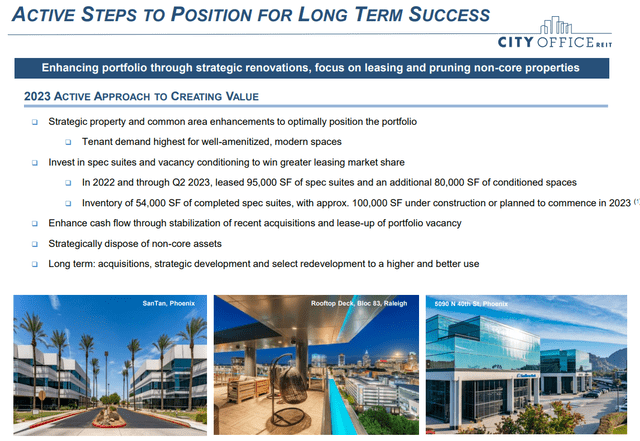
City Office – August Investor Presentation
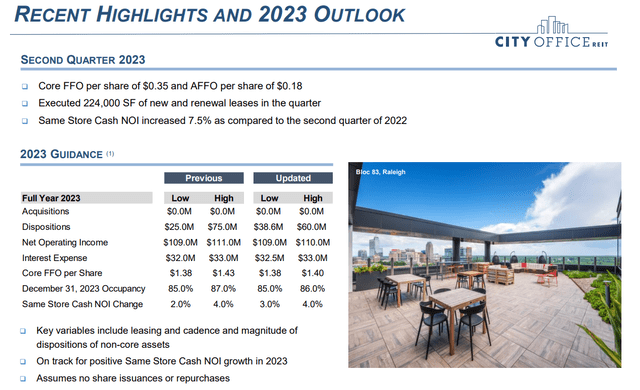
City Office – August Investor Presentation
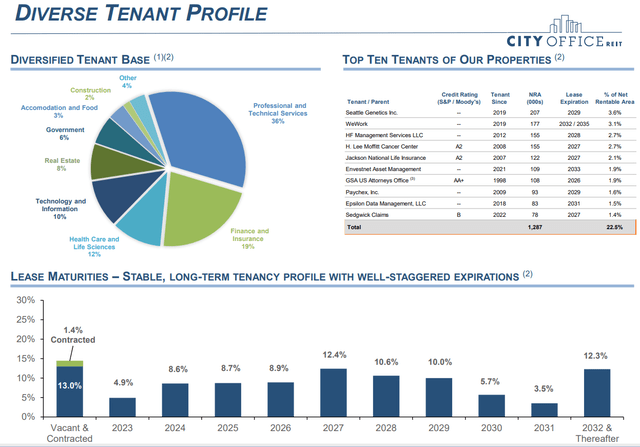
City Office – August Investor Presentation
City Office – August Investor Presentation
City Office – August Investor Presentation
Absurdly Low Valuation
What if new office projects are put on hold over the next 3-5 years (higher interest rates crossed with less lease demand), and the existing supply of buildings matches future demand better than now projected by analysts?
In that case, buying REITs today at incredibly cheap valuations may be a terrific idea to earn above-average investment returns in the future. Let’s review City Office’s valuation profile. Basically, price to trailing sales, cash flow, and tangible book value are now at all-time lows for CIO. The discounts to 9-year averages from its 2014 IPO are in the 60% to 80% range.
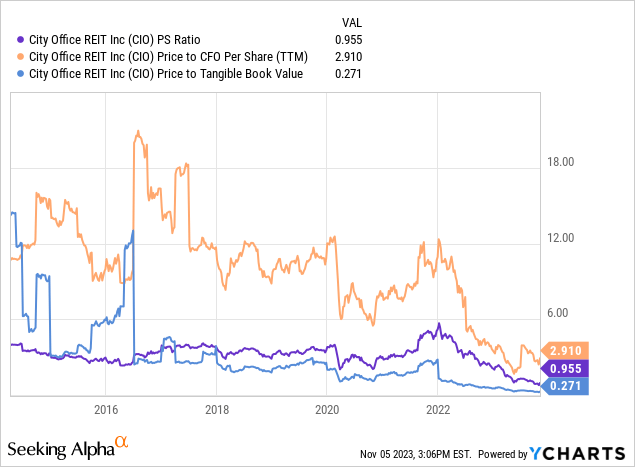
YCharts – City Office, Basic Fundamental Valuations, Since 2014
Of particular note, the equity market capitalization of CIO is far below “net” accounting book value of its office buildings, set at the purchase cost minus GAAP depreciation of each. Believe it or not, today’s minuscule $170 million equity cap is now backed by $1.54 billion in real estate ($1.35 billion) and other assets, a 1:9 ratio. For sure, if you are looking for real estate leverage and believe inflation long-term will be higher than many expect, a list of REITs deserves in-depth research.
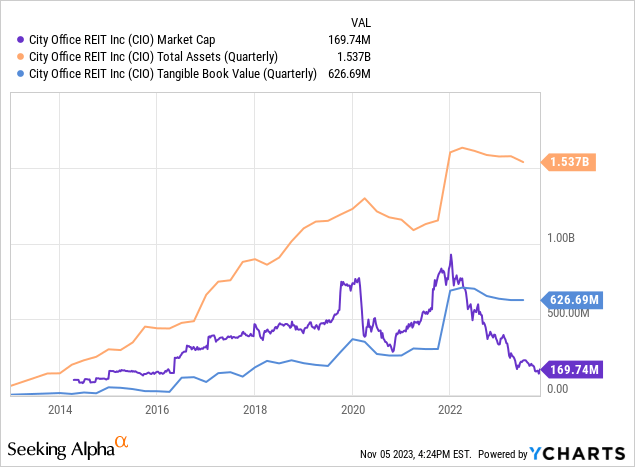
YCharts – City Office, Market Cap vs. Total Assets & Tangible Book Value, Since 2014
On enterprise value, including changing debt and cash levels, City Office is also cheap, although slightly less so. As long as debt stays the same or declines for the company, EV to EBITDA and revenue ratios are quite supportive of materially higher trust pricing.
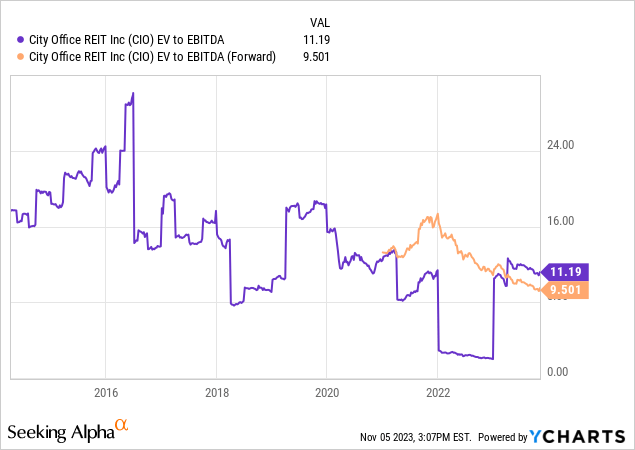
YCharts – City Office, EV to EBITDA, Since 2014
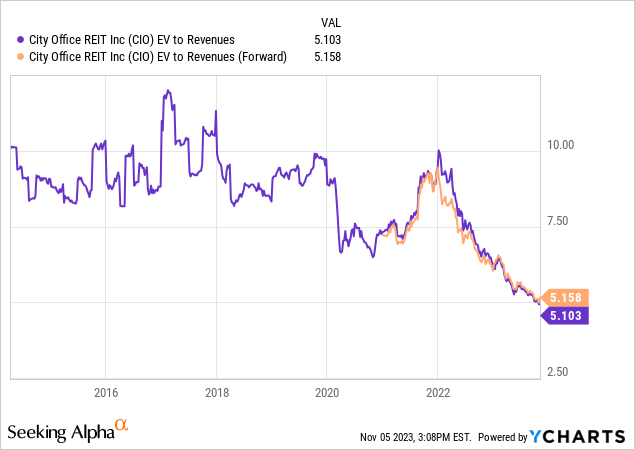
YCharts – City Office, EV to Revenues, Since 2014
Management did cut its dividend in half back in May to conserve cash in this uncertain real estate environment. The annual $0.80 payout has been reduced to $0.40, which is still good for a yield of just under 10%. Of course, if the office market proves resilient during 2024-25, far higher payouts could become a reality again for investors. The new $0.10 payment per quarter is now quite low compared to an expected $1.30+ in FFO (funds from operations) annually during 2023-25.
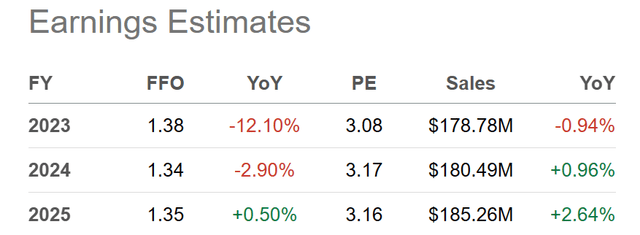
Seeking Alpha Table – City Office, Analyst Estimates for 2023-25, Made November 5th, 2023
Seeking Alpha’s computer ranking system, comparing REITs to peers/competitors on a variety of metrics puts a Valuation Grade of “A+” currently on CIO.
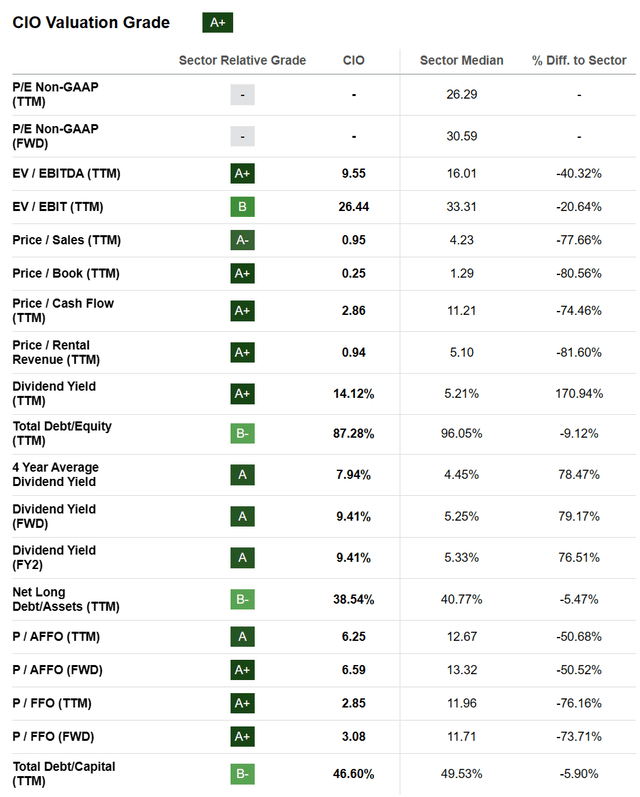
Seeking Alpha Table – City Office, Valuation Grade, November 5th, 2023
Technical Chart
Here’s where the buy proposition gets truly interesting. Trading trends in a large number of REITs are starting to look very similar to the bottoming area for this group following the Great Recession bust in real estate. A clear lack of selling pressure over the last month jumps out to me. Prices have zigzagged lower for months, but aggressive selling ended between March and May for the majority of names.
For CIO specifically, we can review a daily chart of price and volume changes below. I have circled in green the peaks in selling from volume trading, alongside some momentum indicators like the Negative Volume Index (action on lower volume days), Ulcer Index (percentage change over 14 trading days), and Ease of Movement creation (how much volume it takes to generate price change, cumulative over 14 days).
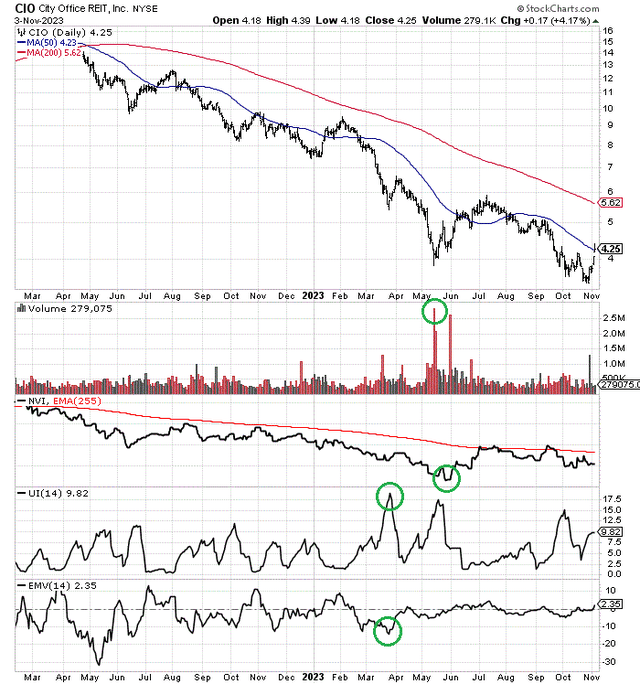
StockCharts.com – City Office, 21 Months of Price & Volume Changes, Author Reference Points
The conclusion is price weakness to new lows in October was not confirmed by aggressive selling stats. Why is this important? Let’s hit the videotape and review what happened to REITs near their lows during early 2009, after the worst real estate carnage in America since the 1930s Great Depression.
I have drawn the same indicators as CIO above, on 24-month charts during 2008-09. Since City Office did not exist in 2009, we are looking at Realty Income (O), one of the largest REIT property owners in America, and a peer office-focused pick in Brandywine (BDN). The whole price and indicator pattern picture in each name during late 2008 and early 2009 at the very least “rhymes” with CIO today. I have also drawn green arrows on the charts to show where CIO “might” be sitting in the bull/bear cycle. Neither is an exact match.
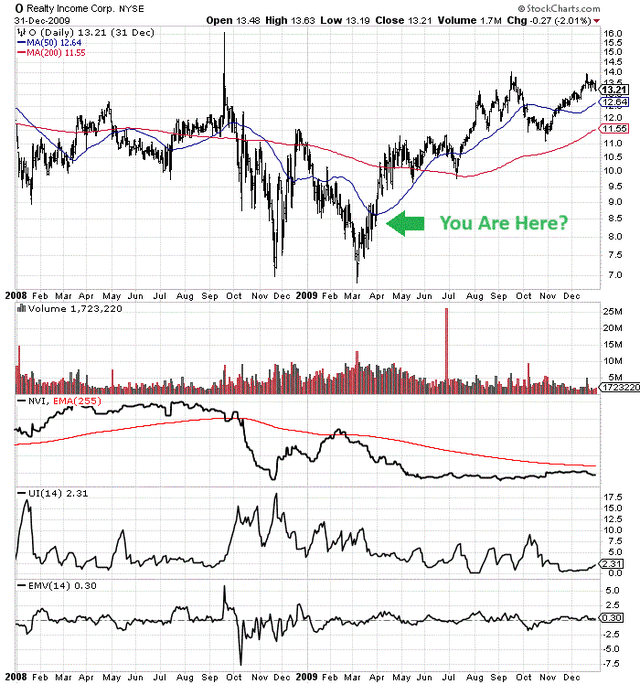
StockCharts.com – Realty Income, Price & Volume Changes, 2008-09, Author Reference Point
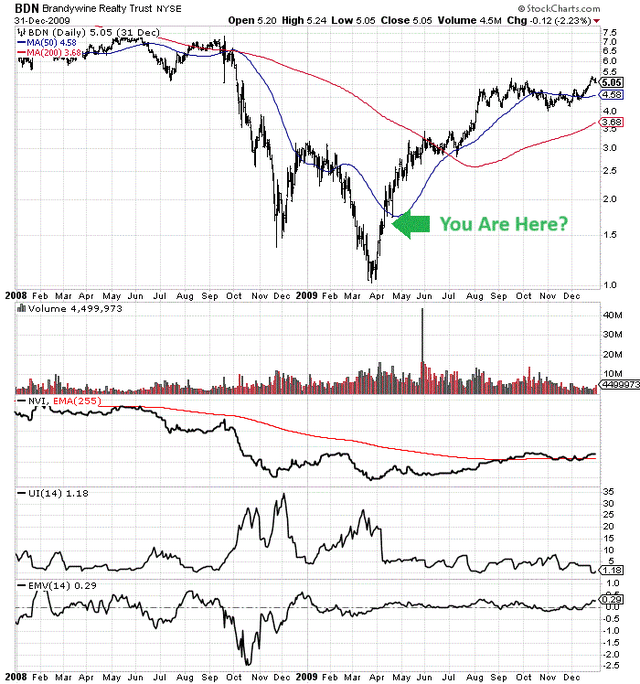
StockCharts.com – Brandywine, Price & Volume Changes, 2008-09, Author Reference Point
To boot, other REITs have outlined a bullish exhaustion in selling pressure during October-November 2023. I own both Realty Income and Brandywine for essentially the same undervaluation logic as City Office. Below are the current chart patterns for each.
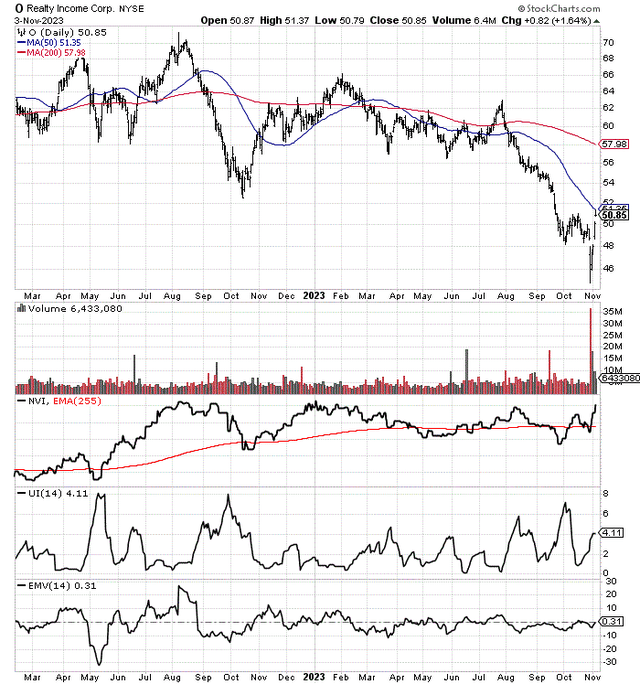
StockCharts.com – Realty Income, 21 Months of Daily Price & Volume Changes
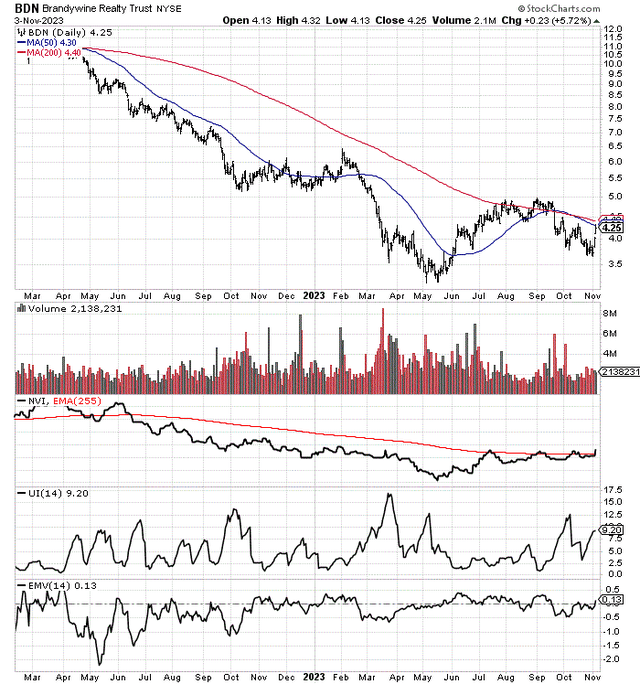
StockCharts.com – Brandywine, 21 Months of Daily Price & Volume Changes
Another technical piece of the puzzle is found in a standard Renko chart. Renko designs try to create trends in price first, with blocks at predetermined equal increments (usually using closing quotes). Then volume over each block period is accumulated and expressed, only after the next block is drawn. Time periods are kind of irrelevant. What is important to understand is this chart shows how much volume it takes to move the price. What I like about CIO’s pattern is heavier selling volumes to move the price over the last couple of months have been replaced by a decent price increase on relatively light volume in recent weeks (boxed in green below).
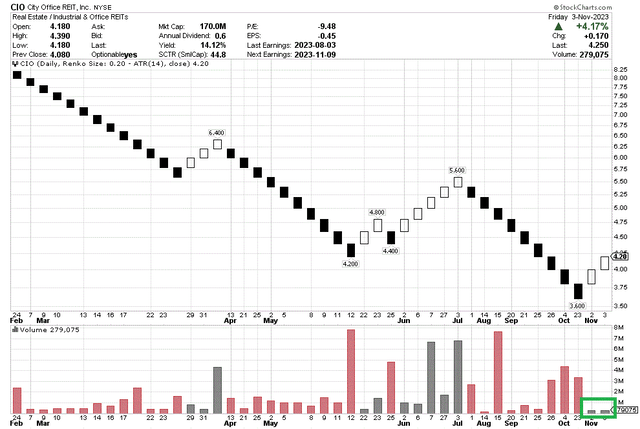
StockCharts.com – City Office, Standard Renko Chart, 10 Months
Again, a similar bullish Renko pattern is evident in Realty Income. If you are a student of equity supply/demand trading dynamics like I am, identifying a vacuum of sellers can often indicate a big price upmove is approaching. Given good news on company operations or a sector-wide inflow of buyers, price will mathematically have to rise to find supply for transactions. Just remember, things can and do change. Assuming a new reason to sell appears (like a deep recession), REITs are not guaranteed to experience large price gains over the short to intermediate term.
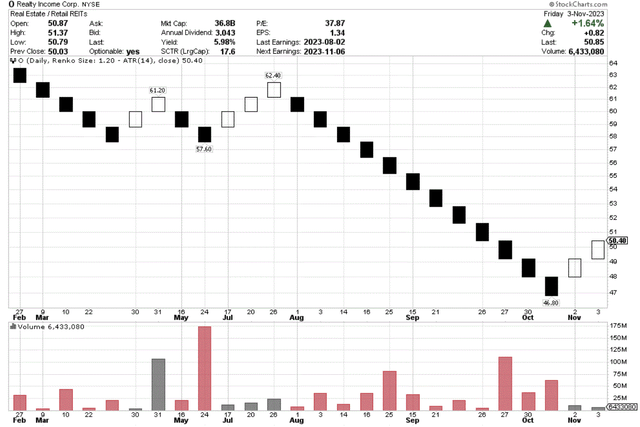
StockCharts.com – Realty Income, Standard Renko Chart, 10 Months
Final Thoughts
I think two primary investment risks stand out for REITs and CIO. First, a deep or prolonged recession in 2024 could hurt the demand for office buildings a year or two down the road beyond current forecasts. City Office would surely stay underwater in price or decline closer to zero for a trust quote. Yet, I think a mild recession is already factored into the valuation. So, if we avoid a major economic contraction or recover quickly (on Federal Reserve easing and new QE bond buying), CIO may be able to rise in a shocking manner vs. weak conventional wisdom expectations, even as bad news on the sector remains on the nightly news for months.
A second and extraordinary risk is the Middle East trouble sending crude oil and energy prices dramatically higher soon. If such plays out, interest rates could continue climbing into early 2024. Part of the excuse to sell REITs has been the rise in borrowing costs is slashing operating results (and growth projections), at the same moment as lower trust pricing becomes a necessity to provide smarter business returns and dividend yields for owners to compete with bonds.
The odds of US$120 or even $150 crude oil cannot be ruled out into early 2024 if Iran decides to launch proxy attacks on Israel from Lebanon or other locations. The worry is Israel and the U.S. could respond in kind possibly through a rapid military strike on Iranian lands and oil infrastructure. Then, Iran reacts by sinking oil tankers in the Persian Gulf, and/or destroying western oil interests across the Middle East including Saudi Arabia.
Otherwise, the bullish arguments to own office REITs as a contrarian, oversold, undervaluation, turnaround bet makes plenty of sense to me. A reversion-to-the-mean advance next year could easily double or triple the stock quote from $4 in early November.
I own expanding position sizes in CIO, O, and BDN, among many other REITs. I will likely continue adding on flat to lower quotes in the weeks ahead. Receiving dividend yields in the 6% to 12% range on “depressed,” slashed, and conservative payouts are a bonus. I rate City Office REIT an interesting risk/reward Buy for long-term accounts, with a Strong Buy rating possible on weaker quotes. I also rate Realty Income and Brandywine as Buys. I did explain Realty Income’s upside potential in an article during October here.
After several years of decline, the REIT sector may be the most opportunistic and productive to search for turnaround situations and major bottoms.
Thanks for reading. Please consider this article a first step in your due diligence process. Consulting with a registered and experienced investment advisor is recommended before making any trade.
Read the full article here

")
")
")
")


")
 Q4 2025 Earnings Call Transcript")
