Investment updates
Following a strong growth period since the June publication, Patterson Companies, Inc. (NASDAQ:PDCO) has sold off sharply after posting its Q1 FY’24 numbers today. The company now sells roughly $3/share off its opening price on 30th August, and there’s no saying where it could bottom based on the rapid liquidity vacuum.
You can see the highs and lows PDCO has posted over the last 12–18 months, where it recently sold at 2022 highs before this sharp reversal. Critically, you can see the price structure collapse in today’s session on the 60 minute chart of Figure 2.
In the last publication I outlined the case for PDCO to sell at $31/share, and the stock had pushed to this level quickly after its last earnings date. Today, it trades at ~13x forward earnings as I write, and my numbers have it do to $2.52/share the bottom line in FY’24. Using historical multiples of 15x forward, I get to ~$38/share in implied value, supporting a buy rating in this instance. This report will unpack the company’s latest numbers and link this back to the broader investment thesis. Net-net, reiterate buy.
Figure 1.PDCO long-term price evolution (weekly bars, log scale)
Data: Updata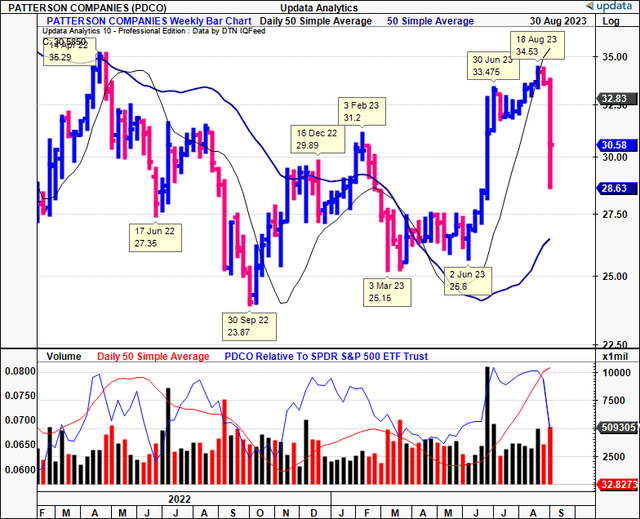
Figure 2. 60-minute bard showing floor falling out from PDCO’s equity stock in today’s session (30th August, 2023).
Data: Updata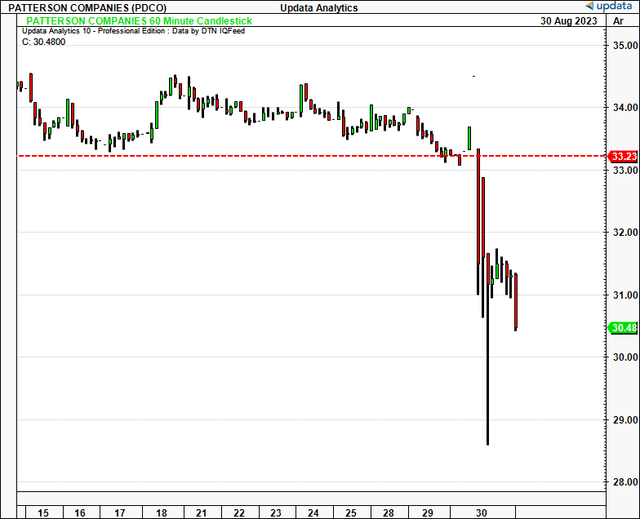
Critical updates to investment debate
Picking apart the company’s latest numbers provides excellent visibility into the remainder of its FY’24. As a reminder, PDCO posted its first quarter results for its fiscal 2024, corresponding with Q2 CY’22. I’ll be talking in terms of Q1 for simplicity and consistency throughout.
Q1 FY’24 insights
- Revenue growth and ‘internal sales’ dynamics
The company put up total sales of $1.6Bn in Q1 FY’24, up 3.5% YoY. Growth was underscored by a 2.8% expansion in ‘internal sales’—a metric PDCO uses to adjust for currency effects and recent acquisitions. Figure 3 segregates the contribution from acquisition revenue and core business growth and shows the ‘internal’ sales figures (see “core business growth”). Organic growth was the main source of business growth in Q1, driving 2.8% of the top-line upside for the quarter, as mentioned. Of this, animal health organic sales were up 4%, with ~80bps of acquisition growth. The remainder of sales upside, ~50bps, was from the firm’s bolt-ons.
Figure 3.
Source: BIG Insights, Company filings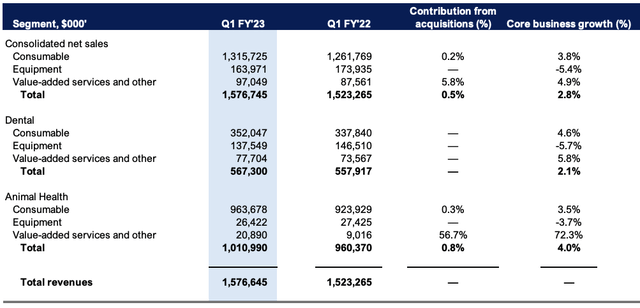
It pulled this to gross of 20.2%, a 25bps compression. But the contraction was mainly due to a 40bp accounting adjustment resulting from the increase in interest rates on its equipment financing portfolio. Critically, the impact was effectively balanced out by corresponding hedging instruments, with minimal impact to bottom line fundamentals.
The divisional breakdown is as follows:
- The Dental segment clipped net sales of $567.3mm on a 2.1% growth in internal sales. Despite contending with deflation in select infection control products, dental consumables still grew 4.6% YoY off the high base in Q2 FY’22. Meanwhile, non-infection control products also commanded attention with a 6.9% growth in internal sales.
- Animal Health (“AH”) revenues were booked at $1.01Bn, corresponding to a 4% rise in internal sales. The AH segment showed good agility in catering to headwinds in its companion and production animal domains. Internal sales of consumables were up 3.5% YoY, even as equipment and software revenues slipped by 370bps from last year.
Figure 3a.
Source: PDCO Q1 Investor Presentation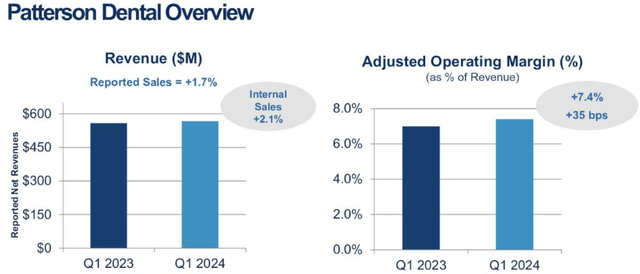
- Capital Expenditure and capital returns to shareholders
PDCO put $17.1mm into CapEx for the quarter, which is $2.5mm more than last year. Management said it diverted capital to enhance distribution capabilities and fortify software capabilities.
Whilst the growth in CapEx is noteworthy, on closer inspection, I wouldn’t consider it investment for future growth. Figure 4 outlines the company’s quarterly capital expenditures. Reported CapEx and ‘maintenance’ CapEx are both shown. Maintenance CapEx is considered roughly equivalent to the depreciation+amortization charge each quarter, and is shown as thus. Only spending above the maintenance capital charge is considered a growth investment.
Critically, growth investment is only seen in Q4 FY’23 in the series, with the remainder of cash flows attributed to maintenance capital. In Q1, it was a $4mm divergence between the maintenance CapEx and what was booked on the cash flow statement.
BIG Insights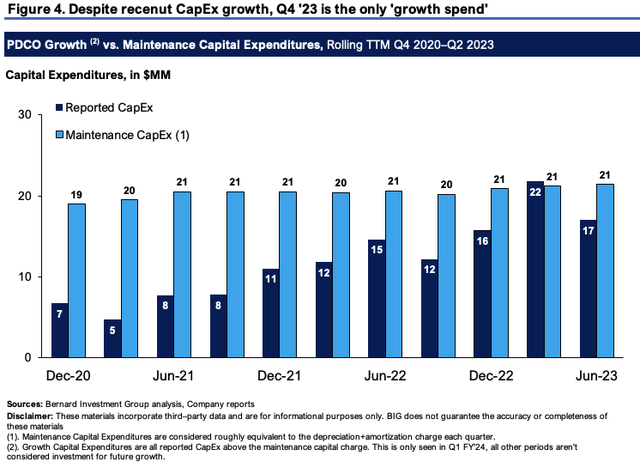
Despite this, PDCO continues its dividend stream and paid up $0.26/share on a $29.50mm of buybacks during the quarter. You’re looking at a 3% forward yield at the current market value, and this could adjust higher if the company’s share price continues to sell lower.
The negative catalyst to its post-earnings drift in market price, in my eyes anyway, isn’t so much that its growth CapEx is lagging or that certain segments incurred headwinds during the period. It’s that earnings have trended lower for the last year or so and the market is taking notice. Granted, this is off a high base throughout the ‘pandemic era’, as shown in Figure 5. Wall Street was expecting $0.40/share and it got just that, but it would appear investors were expecting it to outpace the $0.40 figure, which, if you look at the estimates vs. actuals in Figure 6, you’ll note the company was putting it to The Street and outpaced expectations the last 3 quarters before Q1 FY’24.
This could indeed be a risk going forward. Management expect $2.14—$2.24/share in reported earnings, roughly in-line with FY’23’s numbers. Wall Street analysts now project 2.5% to $2.50/share, above management’s numbers. The divergence may very well narrow over the coming months as the market digests PDCO’s Q1 numbers.
Figure 5.
BIG Insights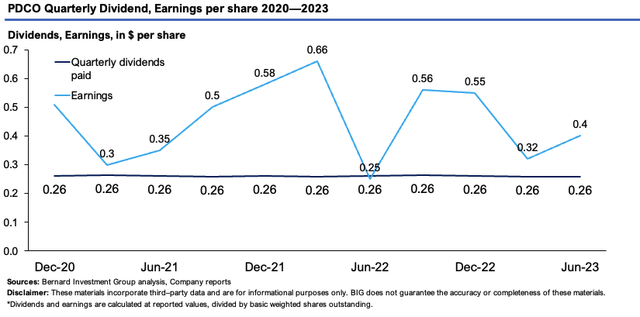
Figure 6. PDCO Estimates vs. Actuals, Earnings Per Share
Source: Seeking Alpha
Valuation and conclusion
Insights are needed to gauge price visibility for PDCO’s equity stock over the coming days post-earnings. The 60 minute point and figure does this well. It looks to the coming days of trade, and doesn’t pay attention to the noise of time, nor does it give any attention to minor volatility flutters mid-trend. It just looks at directional moves, and what to make of price action going forward. There are downsides to $28.50 on the P&F studies, which may very well be an outcome given the price structure today. Note, the targets eyed mostly above $30/share, so I am looking to them closely over the coming days and weeks.
Figure 7. We could be looking at a repricing to $28.50 over the coming days. Given this is a 60-minute chart, it looks to the days ahead, when afterwards, there will likely be new objectives thrown off.
Data: Updata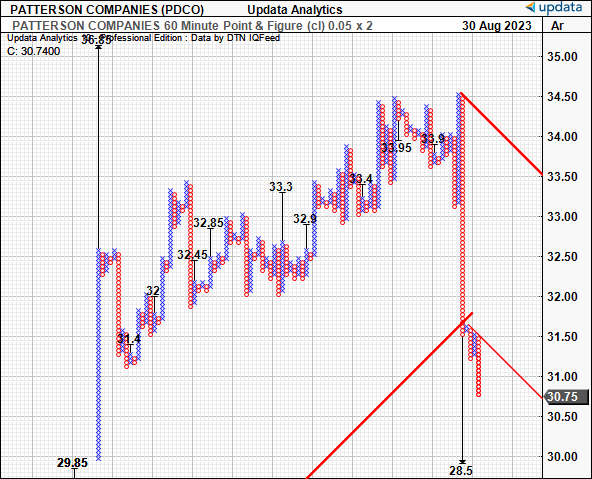
The stock sells at 13.7x forward earnings, and ~10x forward EBITDA. These are both 33% and 29% discounts to the sector, respectively. It sells at 13x forward cash flows which gets you a 7.6% cash flow yield with a 3% forward dividend yield on top, call it ~10% in total. These are quite attractive and paying 13x forward isn’t out of our realm either. It’s also priced below par at 0.5x sales, which might not be the best measure to look at, but is telling of where the market stands on PDCO today.
I believe PDCO has been unfairly punished this time and look more to its long-term multiples of ~15x forward P/E. This gets me to $33/share and implies the stock is marginally underpriced. My numbers have the company dong $2.52 in EPS this year, followed by a jump to ~$2.70 in FY’25. This is a discount to where it sells today at 12.8x P/E. Still, paying PDCO’s historical multiple of 15x derives a price objective of $37.80 using my forward assumptions. In my view, this supports a buy rating, especially with the sharp pullback exhibited today.
Figure 8.
BIG Insights Estimates
In short, the market appears to have punished PDCO as direct consequence to its Q1 numbers and the declining earnings trend on a YoY basis. Critically, these are coming off a high base, and the firm has made commitments to expanding its capacity. Going forward, there will be no more Covid-19 impact (fingers crossed) and investors can look to enjoying the 3% forward dividend yield and ~7% forward cash flow yield on offer. Valuations are also supportive, and I get to ~$38/share using internal FY’24 estimates at 15x forward earnings. Net-net, reiterate buy on valuation grounds.
Read the full article here


