


")
")
One of the highest quality companies on the face of this planet has undoubtedly got to be conglomerate and insurance giant Berkshire Hathaway (NYSE:BRK.A) (NYSE:BRK.B). Under the brilliant leadership of billionaire investor Warren Buffett, this enterprise has grown to become a true behemoth in the business world. From 1965 through the end of 2022, shares have achieved an annualized growth rate of about 19.8%. That’s double the 9.9% seen by the S&P 500 over the same window of time. Although this might make some think that the stock has only doubled what investors would have if they had instead put their capital into it as opposed to the market, the truth is far more impressive. The cumulative return over this window of time for Berkshire Hathaway has been nearly 3.8 million percent compared to the 24,708% seen by the S&P 500.
This tremendous growth has turned the company into the largest non-technology publicly traded enterprise on the planet if we don’t include Saudi Aramco (ARMCO). In fact, as of this writing, Berkshire Hathaway boasts a market capitalization of $762 billion. This is both a blessing and a curse. I say this because, even as the company has grown wealthier, achieving attractive returns has become a true challenge. But even so, Mr. Buffett and his two primary investment managers have continued to fare well. In seven of the past ten years, the conglomerate has outperformed the S&P 500. That has gotten it an annualized return over that window of time of 13.3%. That stacks up against the 12.6% seen by the broader market over the same window of time. This year, performance has lagged slightly, with Berkshire Hathaway up 12.1% compared to the 13.7% seen by the S&P 500. But you can’t win every period of time and this return disparity is not terribly significant over such a short window of time.
Naturally, this brings to question whether a company that continues to generate such a strong upside still makes sense to invest in. After all, too much upside risks a firm becoming overvalued. When digging into the data that is available, it does look as though shares of this prospect are not as cheap as they have been in prior years. But considering how high quality the operation is and strong top and bottom line performance this year, I would argue that additional upside is likely on the table for long-term, value-oriented investors.
Shares look a bit lofty but still make sense
Author – SEC EDGAR Data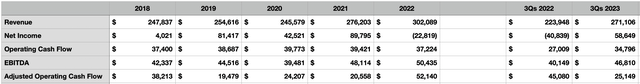
Although I have never owned shares of Berkshire Hathaway, I have been a big fan of Warren Buffett and his work. It was actually reading about him, his life, and his investment philosophy, that got me into investing to begin with. When looking at the overall financial performance of the empire that he built, I have no regrets about admiring him and following the same investment ideology that he popularized. To see what I mean about performance, we need only look at financial data covering the past few years. As you can see in the table above, revenue for the business has grown in four of the past five years, expanding from $247.8 billion to $302.1 billion.
This increase in sales has been driven by both organic means and acquisitions over the years. But in spite of this strong top-line growth, profits and cash flows have not always followed suit. As the aforementioned chart shows, profitability as measured by net income has been all over the map. But a lot of this volatility can be chalked up to investment and derivative gains and losses that I exclude from sales. Operating cash flow has seen similar volatility, and even if we adjust for changes in working capital, the volatility doesn’t look much better. It’s only when looking at a metric that Mr. Buffett dislikes, EBITDA, that we start to see some stability from one year to the next. In fact, if we cut out the 2020 fiscal year, we would see a consistent rise year after year from 2018 through 2022, with the metric growing from $42.3 billion to $50.4 billion.
Author – SEC EDGAR Data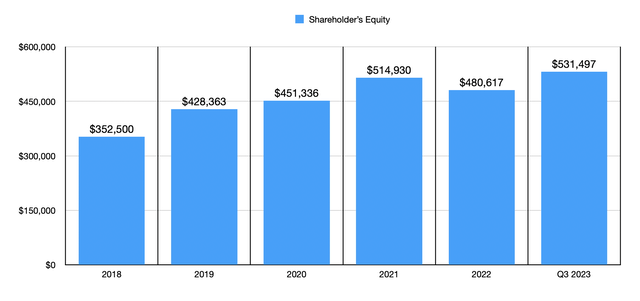
While EBITDA might not be a metric championed by Mr. Buffett, one that he would appreciate is book value. From 2018 through 2021, book value for the company expanded from $352.5 billion to $515 billion. It did see a decline to $480.6 billion last year. But if we fast forward to the third quarter of 2023, we would see that book value has hit an all-time high of $548.6 billion. Much of this performance improvement has been driven by continued strength in 2023. Revenue in the first three quarters of the year came in at $271.1 billion. This stacks up nicely against the $224 billion reported in the first nine months of 2022. The largest chunk of this sales increase came from the company’s acquisition, earlier this year, of a majority of Pilot Travel Centers. That was responsible for $37.4 billion in revenue compared to the goose egg of revenue the company reported for the year prior.
Strength on the top line, combined with stronger operational results that helped the bottom line, and a massive swing from $82.4 billion of losses from its investment and derivatives to a gain of $38 billion, resulted in the firm’s net profits turning from negative $40.8 billion to positive $58.6 billion. Other profitability metrics followed suit. Operating cash flow, for instance, grew from $27 billion to $34.8 billion. It is true that the adjusted figure fell year over year. However, this is offset by the fact that EBITDA grew from $40.1 billion to $46.8 billion.
Author – SEC EDGAR Data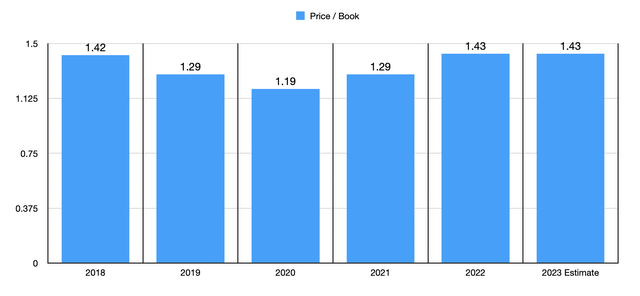
When it comes to valuing the company, there are three ways that I would like to discuss. The first and easiest is to use the price to book multiple. As you can see in the chart above, from 2018 through the present day, the company has traded at a price to book multiple that has been within a fairly narrow range. The low point was the 1.19 traded back in 2020. But that’s not surprising given the global pandemic that was going on at that time and the fear that was created in the market. Today, the multiple stands at 1.43. That matches the 1.43 seen at the end of last year. However, it’s not so high as to classify the company as overvalued in my opinion.
Author – SEC EDGAR Data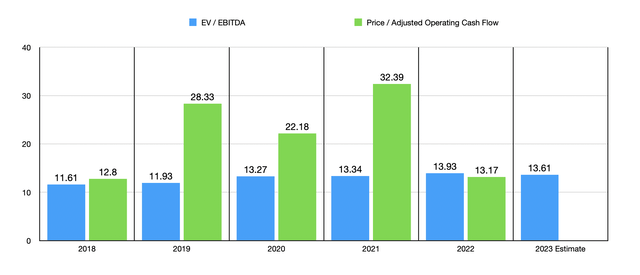
Another method that we can rely on is the price to adjusted operating cash flow multiple. But as the aforementioned chart demonstrates, this metric has been very volatile from one year to the next. The fact of the matter is that the very nature of Berkshire Hathaway results in cash flows posting inconsistent results from quarter to quarter or year to year. In fact, adjusted operating cash flow is so volatile that I did not estimate what the multiple might look like on a forward basis. Instead, I stopped at what the company achieved for the 2022 fiscal year. If we rely on the EV to EBITDA approach instead, we end up with results that are much more in line with one another from time period to time period. Interestingly, what this does show is a consistent uptrend in the price that investors have to pay in order to participate in further upside of Berkshire Hathaway. Back in 2018, the company was trading at an EV to EBITDA multiple of 11.61. By the end of 2022, the metric had increased to 13.93. And today, the forward estimate that I put on it is 13.61.
Author – SEC EDGAR Data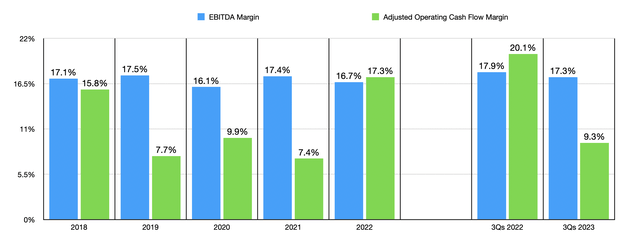
A case could be made that a higher price for a higher quality company is completely justified. And one of the best ways to gauge quality is to look at profitability margins. In the chart above, for instance, you can see both the adjusted operating cash flow margin and the EBITDA margin over the past five years and for the first nine months of 2023. As expected, the former of these is quite volatile. However, the latter shows a good degree of consistency. What it does not show, however, is any meaningful improvement. So that indicates to me that the market is valuing the same quality of cash flow slightly lower than what it did a year ago, but higher than what it did two years ago or three years ago.
If I were to put this data out and not provide any additional context, it might be interpreted as me saying that shares are overvalued. But I don’t think that’s necessarily the case. While the stock does look lofty compared to what it has in prior years, the elevated price does not place it out of the range of what I would expect for such a world-class enterprise. There’s also the fact that the conglomerate is safer because its cash and cash equivalents just peaked at a new high of $157.2 billion in the third quarter. As the chart below illustrates, this is well above what the company has had on its books in prior years. This is great in the sense that the end result is tremendous fundamental safety and stability for the company. But there is a dark side to this. You see, back when I was in college, Mr. Buffett was known for saying that he didn’t like to have much more than $40 billion in cash on hand. After all, cash generates a low return on investment when not deployed toward productive assets. Naturally, the company is far larger today than it was back then. So having additional cash on hand only makes sense. But it would be nice to see that capital allocated toward something else instead.
Author – SEC EDGAR Data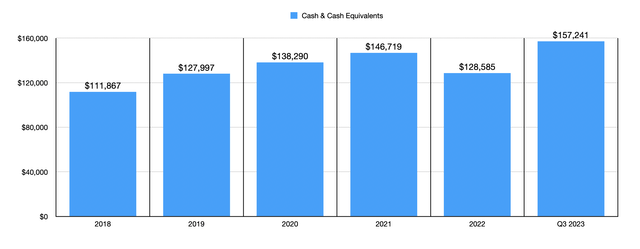
Throughout this article, I have covered data covering a span of five years, plus covering the first three quarters of the 2023 fiscal year. The most recent of this data, which involves the third quarter of this year, was just announced on November 4th. While we are digging into the health of Berkshire Hathaway, it would be a wise idea to touch on some other new data that reinforces that view. For starters, management is also optimistic about the enterprise as evidenced by the fact that the company repurchased $1.1 billion worth of shares in the third quarter. That brings total share buybacks so far this year to $7 billion and places it well on track to surpass the $7.9 billion repurchased during all of last year.
At the end of the day, this has only been made possible not only by the large amounts of cash on Berkshire Hathaway’s books but also by the fact that the company continues to see its profits rise. You have already seen key financial metrics that prove this but, with the exception of cash flow, the best metric is one that Mr. Buffett is a fan of: operating earnings. During the third quarter, operating earnings for the company totaled $10.8 billion. That’s up nicely from the $7.7 billion reported one year earlier. That brings operating earnings for the first nine months of this year up to $28.9 billion compared to the $24.2 billion seen one year earlier.
Berkshire Hathaway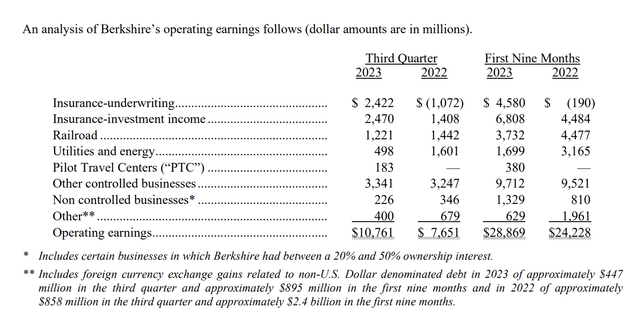
Interestingly, some of the company’s core operations faced significant declines. As you can see in the image above, its Railroad and Utilities & Energy units suffered material weakness year-over-year. It was only by the grace of the company’s insurance businesses that profits increased. That strength was the result of lower catastrophe losses, better overall performance at GEICO, the benefit of higher interest rates, and the fact that float has now risen to $167 billion compared to the $164 billion seen at the end of 2022.
Takeaway
Based on the data that’s available, Berkshire Hathaway is clearly trading at rather lofty multiples compared to where it has over the past few years. But even with that factored in, shares do seem to be trading at levels that I would consider to be reasonably attractive. The attractiveness of the company is boosted further by the safety that comes along with a large amount of cash on hand. But at the same time, this also comes with the downside that the more cash the company has, the less of its overall capital investors are seeing deployed in ways aimed at furthering growth. When I add all of this together, my overall conclusion is that, while shares are not as cheap as they have been in the recent past, they are appealing enough to warrant a soft ‘buy’ right now.
Read the full article here

")
")
")
")


")
 Q4 2025 Earnings Call Transcript")
