
")


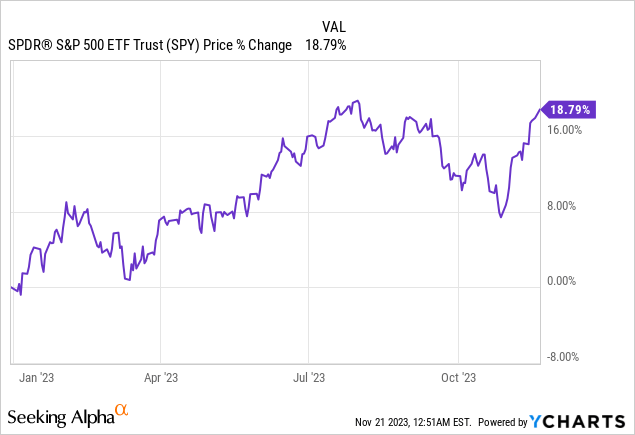
Are we on the verge of a year-end rally for the SPDR S&P 500 ETF Trust (NYSEARCA:SPY)? It appears so, with the rally gaining momentum since the end of October.
US inflation has come in lower than expected, unemployment remains a non-concern, and the market is increasingly betting on interest rate cuts by the Federal Reserve from 2024 onwards. This belief is grounded in the soft landing thesis, where the Fed aims to control inflation without triggering a recession. This optimism has resulted in a notable upswing in global stock markets.
However, it’s crucial to note that the Federal Reserve, led by Jerome Powell, has not officially declared victory over inflation. This is the focal point of our discussion in this article because it’s essential to reassess the recently released indicators given the persistently challenging macroeconomic scenario.
Amidst such uncertainty, taking a position can be challenging. However, currently, my inclination leans more toward pessimism than optimism. I believe that any potential year-end rally is likely to be short-lived, considering the overall context of the indicators in the American economy.
Inflation Seems Under Controlled
Starting with US inflation, core and overall inflation have recently come in slightly below consensus expectations. Total inflation, expected to rise 0.1%, recorded 0% for the month, resulting in an annual inflation rate of 3.2%.
Similarly, core inflation, anticipated at growth of 0.3%, ended up at 0.2%, maintaining a 4% year-over-year level. This doubles the Fed’s target, presenting an ongoing challenge for monetary policy. Nevertheless, it’s worth noting that inflation has been experiencing a slowdown, with a typically benign trend, barring any geopolitical issues involving commodities such as oil, which I’ll delve into later in this article.
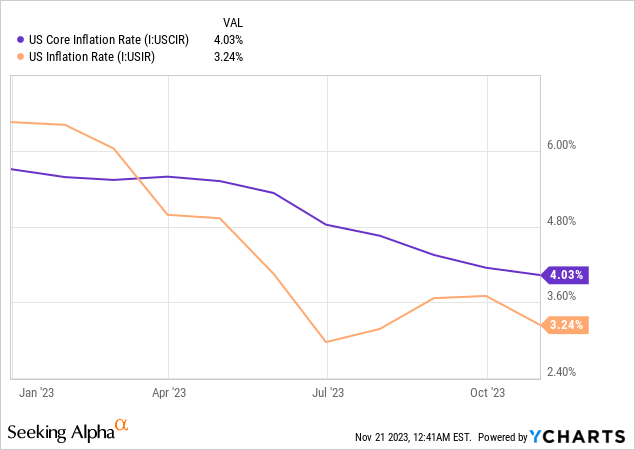
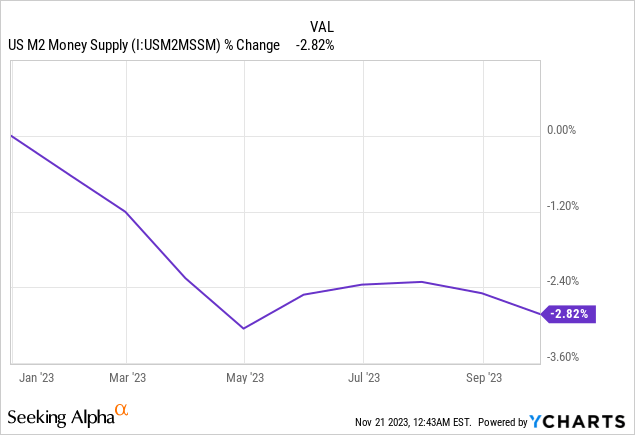
When examining macro inflation data, we observe a decline, with inflation currently at 3.2%. This is a notable reduction from its peak of 9.1%. Core inflation is also clearly on a downward trajectory, currently at 4.00, aligning with expectations when analyzing monetary indicators like the US M2 Money Supply. The M2, encompassing printed paper money bank demand and term deposits, has a year-over-year reading drop of 2.82%, based on data released for September, possibly signaling reduced liquidity in the economy.
The anticipated downward trend in inflation was expected, yet the positive monthly reading has prompted the market to reassess its bets on interest rate cuts. One consensus emerging is the near certainty that further interest rate hikes by the Fed are practically ruled out. Estimates for the upcoming December meeting indicate almost a 100% probability of unchanged interest rates.
The recent stock market rally has been notably significant, with a 9% increase from October 30th to the present day, particularly following the release of US inflation data. This upward trend persists. The current, more favorable macroeconomic scenario favors global stock markets, especially regarding monetary policy.
Indicators Still Show More of a Recession Than the Opposite
Several investors and economists have predicted a recession by 2023 based on indicators, but the anticipated recession has not materialized. For instance, Michael “Big Short” Burry, who famously bet against the S&P 500 with a short position, recently closed that position with a 40% loss, highlighting the complexities of market dynamics. While challenges persist, it is clear that the current macroeconomic landscape is influencing market sentiment, and careful monitoring remains essential.
Understanding the market’s direction is no easy task, but the truth is that indicators persistently point toward a looming recession rather than the opposite.
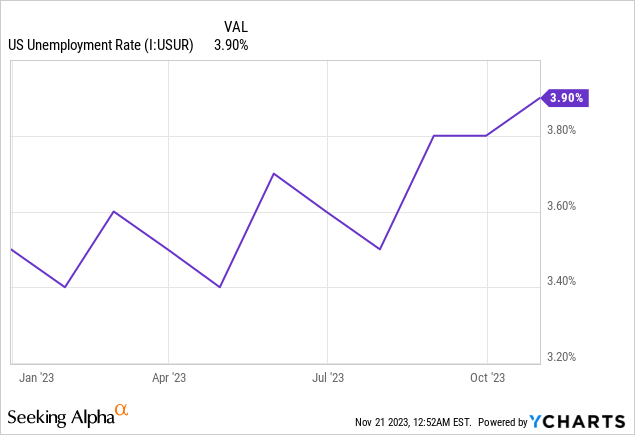
Some indicators have yet to deteriorate enough to definitively declare a recession, as seen in the case of employment, which remains remarkably resilient at 3.9%.
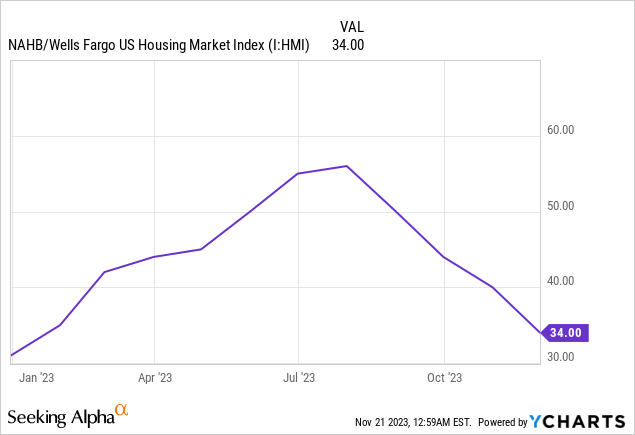
On the other hand, it’s crucial to note a subtle shift in perception within the real estate sector, indicating a decrease in positivity and optimism compared to last year. The housing market indicator, the NAHB US Housing Market Index, has regressed to 34. Any reading below 50 signifies pessimism or contraction in this market, which currently stands notably pessimistic.
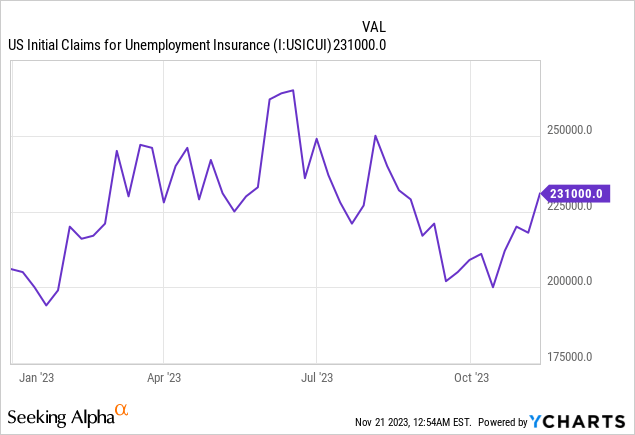
Examining the initial applications for jobless claims, the latest data showed an increase since October, reaching 231,000 new claims. However, it remains at a shallow level, presenting nothing discouraging. Continuing claims are also at the highest level in the last year and a half, but there is no cause for significant concern.
Trading economics showed retail sales fell by less than 0.1%, lower than the consensus had anticipated. While it’s a positive figure, it does suggest a beginning of weakening in the retail sector. This weakening is further supported by data from companies like Target (TGT), which reported results on November 15. Although its stock surged due to higher profits, it also revealed lower sales. Target reported a 4.9% decline in comparable sales for the third quarter, attributed to a sustained reduction in spending in discretionary categories.
This downward trend in sales echoes the sentiment felt by other retailers, as observed in the case of Walmart (WMT). The CFO of Walmart expressed caution about the American consumer, stating that it is more cautious about the American consumer than it was 90 days ago. The impact on the stock was significant, plunging over 8% post-earnings, underscoring growing concerns about the American retail landscape.
Other Indicators Not to Be So Excited About
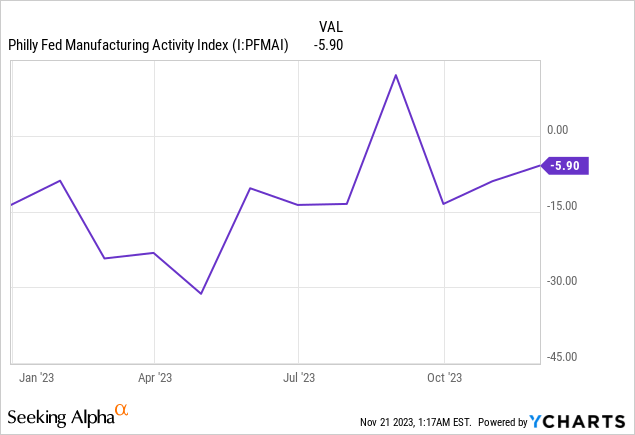
Introducing more indicators, the Philadelphia Fed Manufacturing Index experienced another decline in November, mirroring a slight drop in the business conditions indicator from the previous month. The shipments index turned negative, and the new orders index remained positive but low. The firms mainly indicated steady employment, and the current price indexes suggest price increases.
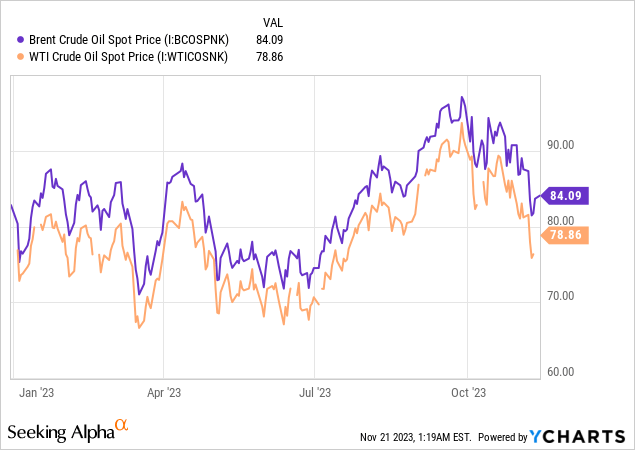
The latest significant piece of data is the oil price decline today, with Brent and WTI falling by almost 5%. Additionally, there is a nearly 5% drop in gasoline and diesel oil prices, reaching their lowest level in nearly 12 months. This suggests the market might anticipate a slowdown in the U.S. and Chinese economies.
But Will a Year-End Rally Happen?
It seems premature to celebrate a soft landing. While a mild recession is ruled out, the macroeconomic scenario remains challenging. In my view, it’s not yet the time to adopt a heroic stance in the stock market.
While a rally in the S&P 500 might be on the horizon, delving into the fixed-income credit market reveals a complex landscape. Several fixed-income investments offer returns exceeding 5%, 6%, and even 7% in this market. This complexity challenges the simplicity of investing today, especially compared to the conditions of 2021 and 6-7 years ago, where interest rates were at zero, and the incentive to take risks was more explicit.
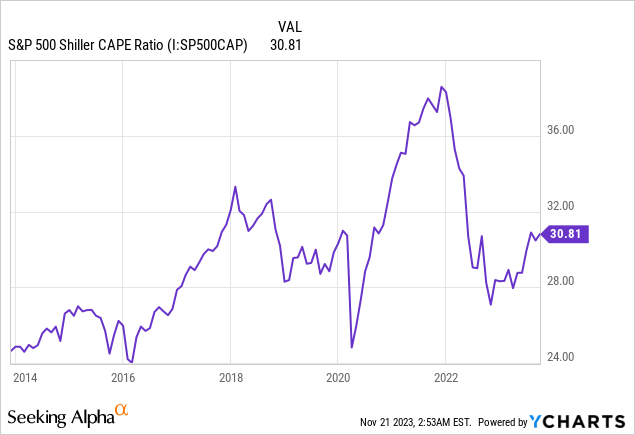
Valuations also seem to be elevated compared to historical norms, as indicated by the Shiller CAPE ratio of the S&P 500. The current situation bears similarities to the pre-COVID-19 period. However, a reverse scenario is unfolding this time, with the Federal Reserve damping the economy rather than stimulating it.
Presently, alternative investment options exist, and the cost of opportunity is no longer negligible. Despite indicators pointing towards the potential for a year-end rally, the historical context and the chart of the US Treasury’s tax collection provide a nuanced perspective. In the last 12 months, tax collection has experienced a nearly 10% decline, surpassing the fall during the pandemic and reaching a level akin to that observed during the 2008 financial crisis.
Federal government current tax receipts (FRED)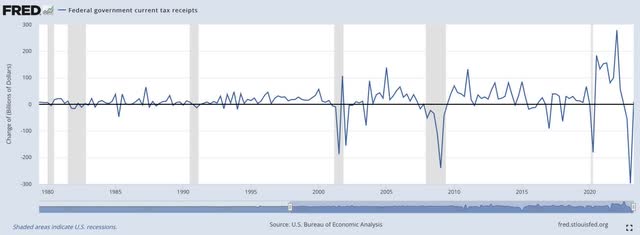
This tax collection trend is a crucial indicator to scrutinize, as the decline in revenue typically aligns with periods of recession, as seen in the shady areas in the chart in 2000-2001, the 2007-2009 recession, the 2020 recession, and possibly signaling a new downturn.
The question arises: Will the market overlook these indicators and declare a victory, believing that the Fed can cut interest rates? While possible, there remains uncertainty, and the market’s reaction may not align with these indicators.
I find it highly unlikely that the S&P 500 will emerge unscathed. Even if there is a rally, it’s likely to be short-lived, considering that some leading indicators point more towards a recession than the opposite.
Read the full article here
")

 Q4 2025 Earnings Call Transcript")
")
")
")
")
")
