Part I – Introduction
Idaho-based Hecla Mining Company (HL) produces 40% of all silver made in the USA and relies heavily on this commodity, which has slowly turned bullish recently after a long bearish period.
HL Assets Map (HL May Presentation)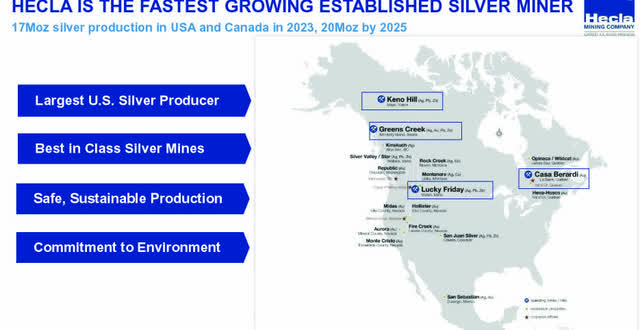
The Company released its second quarter 2023 results on August 8, 2023.
Note: This article updates my article published on May 20, 2023. I have followed HL on Seeking Alpha since June 2019.
President and CEO Phillips Baker said in the conference call:
This second quarter was a good quarter for safety, production, cash flow and starting changes at Casa, but maybe the most significant event of the quarter is the restart of the Keno mill, because when you combine that with what is happening at Greens Creek and Lucky Friday, I think that Hecla is now in another period of substantial growth in silver production reserves and maybe even faster than what we had over the last five years.
1 – 2Q23 Results Snapshot
Hecla Mining announced the Company produced 3,832,559 Ag Oz and 35,251 Au Oz in the second quarter of 2023.
Lucky Friday production reached 1.3Moz, and Keno Hill began ramp-up with production in 2Q23 of 184,264 Ag Oz.
HL 2Q23 Guidance (HL Presentation)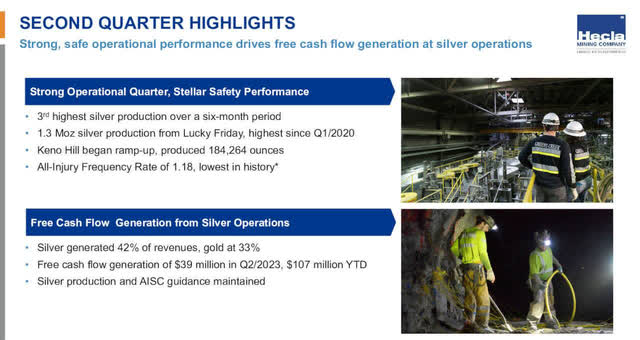
Revenues increased again to $178.13 million, up from $191.24 million a year ago and down from $199.50 million in 1Q22.
HL paid a quarterly dividend of $0.00625 in the second quarter. The dividend yield is now 0.51%.
2 – Stock performance
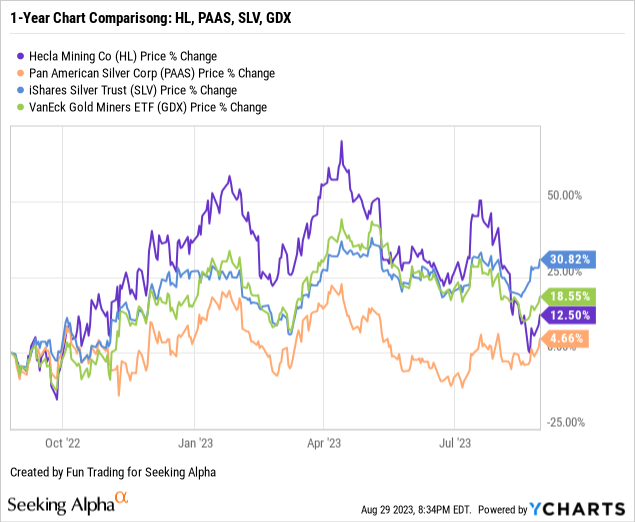
Hecla Mining is up 13% on a one-year basis. HL has underperformed the iShares Silver Trust (SLV) and the VanEck Vectors Gold Miners ETF (GDX) in one year.
I have also indicated Pan American Silver (PAAS), which represents a good comparison, and we can see that PAAS has underperformed HL and is now up over 4%.
4 – Investment thesis
I consider Hecla Mining a decent long-term company, but using HL stock as a trading tool presents more advantages and reduces the risk attached to the nature of the assets.
Gold and Silver prices have increased significantly in 2023 and, despite some recent weakness due to the FED decision to raise interest rates in 2023, are still around $1,943 (24-hour spot gold) and $24.60, respectively.
HL 1-Year Chart Gold, Silver, Copper (Fun Trading StockCharts)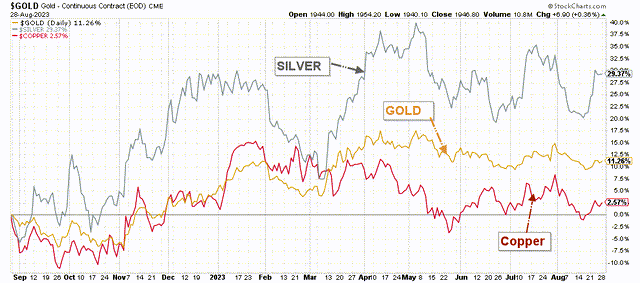
Thus, HL is expected to benefit from high commodity prices and increased production in 2023, particularly in H2 2023, with Keno Hill silver production adding between 2.5 Moz to 3.0 Moz of silver starting in 3Q23. The mine contributed over 184K Ag Oz in 2Q23.
However, as I said in my preceding article, Hecla Mining Company is small and presents recurring technical issues.
announced an update on the Lucky Friday mine. A fall of ground occurred in the mine’s #2 shaft, a secondary egress, at an unused station that was under repair. While a full inspection has not occurred, the failure appears to be caused by a fire that is contained and under control. Steps are being taken to ensure the fire is extinguished before normal ventilation is re-established.
The incident occurred approximately 500 feet from the bottom of the active portion of the shaft and is expected to impact production and cost guidance for the mine.
Thus, I suggest trading short-term LIFO HL using at least 40% of your total position – more details at the end of this article.
Hecla Mining – Company Balance Sheet And Production In 2Q23 – The Raw Numbers
| Hecla Mining | 2Q22 | 3Q22 | 4Q22 | 1Q23 | 2Q23 |
| Sale Revenue and others in $ million | 191.24 | 146.34 | 194.35 | 199.50 | 178.13 |
| Net Income in $ million | -13.52 | -23.53 | -4.45 | -3.17 | -15.69 |
| EBITDA $ million | 35.44 | 10.91 | 41.04 | 50.13 | 34.50 |
| EPS diluted in $/share | -0.03 | -0.04 | 0.00 | -0.01 | -0.03 |
| Cash from operating activities in $ million | 40.18 | -24.32 | 36.12 | 40.60 | 23.78 |
| Capital Expenditure in $ million | 34.33 | 37.43 | 56.14 | 54.44 | 51.47 |
| Free Cash Flow In $ million | 5.85 | -61.75 | -20.02 | -13.84 | -27.69 |
| Total cash $ million | 198.19 | 144.67 | 104.74 | 95.94 | 106.79 |
| Total debt in $ million | 534.54 | 530.75 | 517.74 | 516.96 | 559.82 |
| Dividend per share in $ | 0.00625 | 0.00375 | 0.00625 | 0.00625 | 0.00625 |
| Shares outstanding (diluted) in a million | 539.40 | 554.53 | 597.38 | 600.08 | 604.09 |
| Silver and Gold Production | 2Q22 | 3Q22 | 4Q22 | 1Q23 | 2Q23 |
| Silver Production K Au Oz | 3,645 | 3,549 | 3,663 | 4,042 | 3.832.6 |
| Gold production K Ag Oz | 45.72 | 44.75 | 43.70 | 39.72 | 35.25 |
| Silver realized $/oz | 20.68 | 18.30 | 22.03 | 22.62 | 23.67 |
| Gold price realized $/oz | 1,865 | 1,713 | 1,757 | 1,902 | 1,969 |
| Ag AISC by-product | 8.08 | 12.93 | 13.98 | 8.96 | 11.63 |
Data Source: Company material.
Part II – 1Q23 Gold and Silver Production Snapshot
1.1 – Second quarter production
HL delivered mixed production results this quarter. Gold production came in at 35,251 Oz of gold, down 11.2% sequentially, and 3,832,859 Oz of silver, up 5.2% sequentially. HL produced 12,906 tons of Lead and 16,593 tons of Zinc.
Note: A metric Tonne represents 2,204.6 pounds.
HL Quarterly Gold and Silver Production (Fun Trading)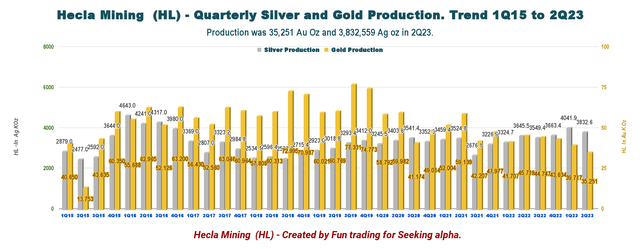
Production detail per mine:
HL 2Q23 Gold and Silver Production per Mine (Fun Trading)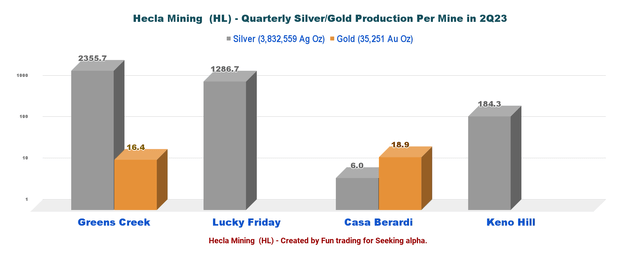
Details per mine:
1.1.1 – The Lucky Friday mine silver production.
The Lucky Friday Mine produced 1,286,686 Ag Oz in 2Q23, or an increase of 1.9% sequentially. The increase was due to higher grades partially offset by lower throughput due to the local utility’s unplanned replacement of the main electrical transformer. Second quarter silver production was the highest since the first quarter of 2000.
HL Lucky Friday Production History (Fun Trading)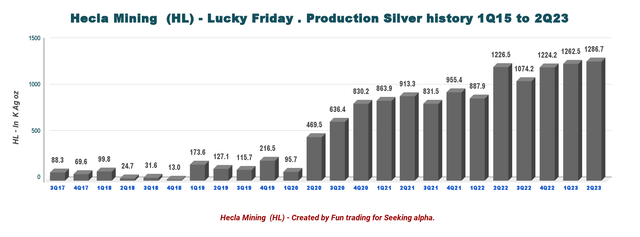
1.1.2 – Casa Berardi’s gold production
The Casa Berardi Mine produced 18,901 Au Oz in the second quarter of 2023, a decline of 23% compared to 24,686 ounces in the first quarter. The mine also produced 5,956 Ag Oz.
The decrease was primarily due to lower tons mined and milled because of wildfires-related suspension in June. The mill operated at an average of 4,600 tpd during the first two months of the quarter.
HL Casa Berardi Quarterly Production History (Fun Trading)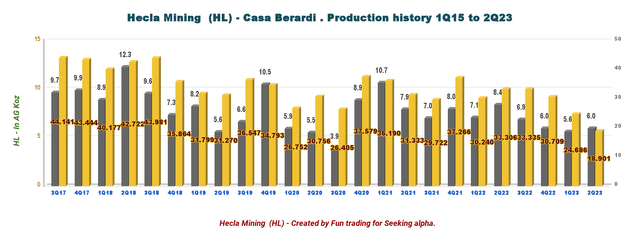
1.1.3 – Greens Creek
The Greens Creek mine produced 2,355,674 Ag Oz and 16,351 Au Oz in the second quarter, an increase of 14% and 10% over the preceding quarter. A decrease of 15% over the prior quarter due to expected lower mined grades. Gold production increased by 10% due to higher grades; zinc and lead production was consistent with the preceding quarter.
Throughput for the quarter was 2,555 tons per day, and the mine remains on track to achieve an annual throughput of 2,600 tpd by year-end.
HL Greens Creek Production History (Fun Trading)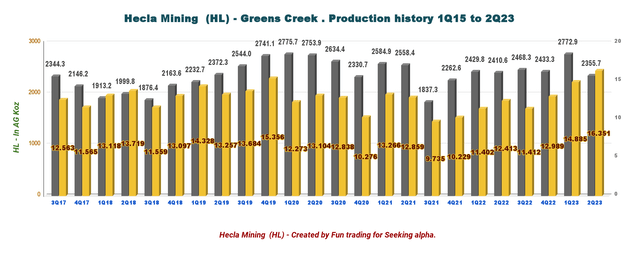
1.1.4 – Keno Hill
$3.7 million of exploration is expected for the year. This quarter focuses on extending mineralization and resource conversion at the high-grade Bear Zone and defining new mineral resources at the Townsite Zone.
The mill restarted and began processing lower-grade, stockpiled ore in June, producing 184,264 ounces of silver for the quarter. The mill operated as expected at 330 tpd, 73% of the projected year-end throughput, processing stockpiled, lower-grade ore of 17 ounces per ton.
The mine will be a solid silver production in 2024, potentially reaching 4 Moz of silver.
HL Keno Hill (HL Presentation)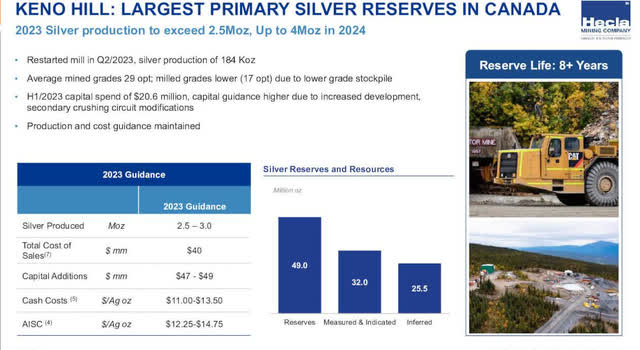
1.1.5 – AISC
In 2Q23, Hecla Mining sold its silver at $23.67 per Ag ounce and $1,969 per Au ounce. AISC Silver was $11.63 per Ag Ounce. Lead $0.99 per pound and Zinc $1.13 per pound.
HL Quarterly Silver Production and AISC History (Fun Trading)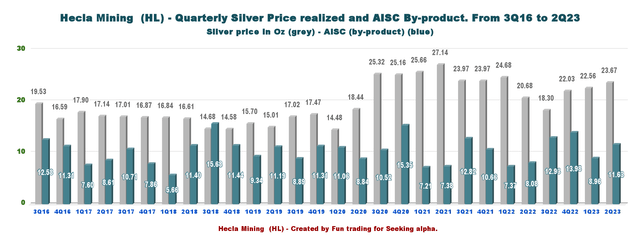
1.2 – 2023-2025 guidance decreased.
Production in equivalent gold ounces is expected to be 480K-520K GEOs (Lucky Friday hiccup), dropping slightly in 2024 and stabilizing to 450K-495K in 2025.
HL 2023 Guidance (HL Presentation)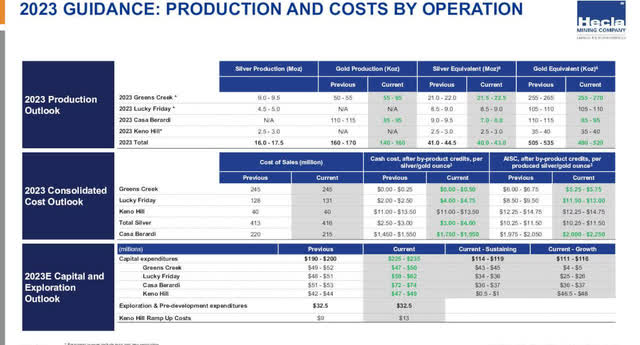
Part III – Financial Snapshot
1 – Total revenues were $178.13 million in 2Q23.
HL Quarterly Revenue History (Fun Trading)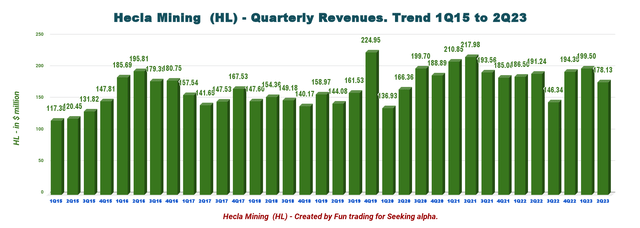
The revenues were $178.13 million in 2Q23, down from $191.24 million a year ago and down from $199.50 million in 1Q22.
Hecla Mining reported a second-quarter loss of $15.69 million, or 0.03 per diluted share, compared to a loss of $13.52 million in the same period a year earlier, or $0.03 per diluted share.
2 – Free cash flow was negative $27.69 million in 2Q23.
HL Quarterly Free Cash Flow History (Fun Trading)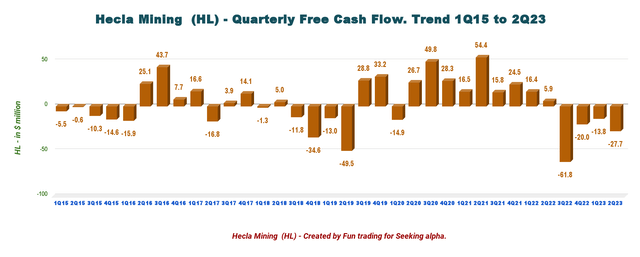
Note: The generic free cash flow is the cash from operating activities minus CapEx. The FCF indicated below can be compared with any other company. Hecla Mining uses another way to calculate the FCF, which is inconsistent with the broad calculation (see Presentation below).
Trailing 12-month free cash flow was negative $123.30 million, with a negative free cash flow of $27.69 million this quarter.
3 – The net debt is $453 million in 2Q23.
HL Quarterly Cash versus Debt History (Fun Trading)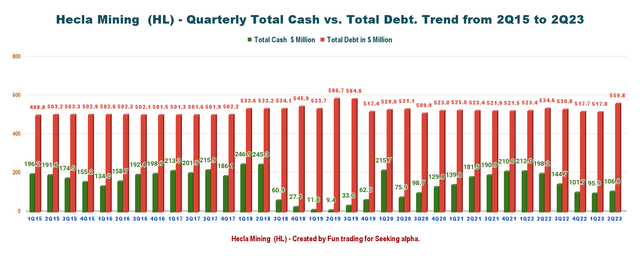
The Company indicated $106.79 million in total cash. Net debt is now $453 million. Available liquidity is $219 million for the second quarter.
The net debt/LMT adjusted EBITDA is 2.1x, unchanged from the preceding quarter.
HL Balance Sheet (HL Presentation)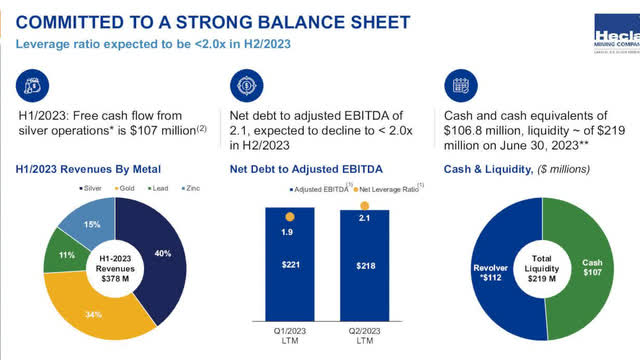
CFO Russell Lawlar said in the conference call:
We ended the quarter with $107 million of cash on our balance sheet and had liquidity of $219 million. We also monetized our zinc hedges for approximately $7.6 million as the zinc price declined to its lowest point in the second quarter since April 2020. The strength of our balance sheet and financial flexibility, with a net leverage ratio of less than 2x, remains one of our most important objectives.
Part IV – Technical Analysis And Commentary
HL TA Chart Short-Term (Fun Trading StockCharts)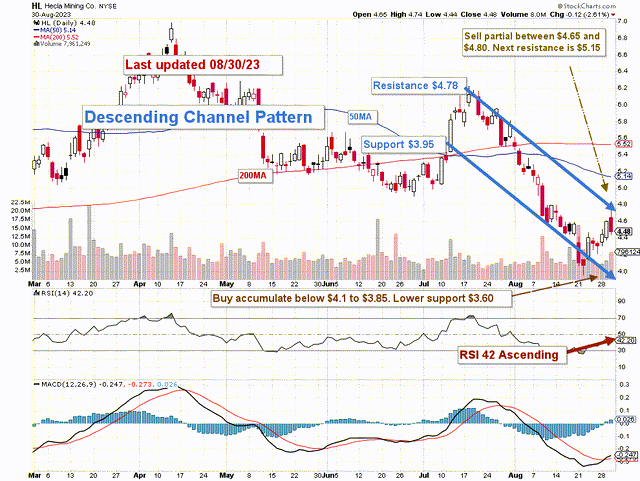
Note: The chart is adjusted for the dividend.
HL forms a descending channel pattern, with resistance at $4.78 and support at $3.95. RSI is 42 ascending, suggesting a possible breakout soon.
Descending channel patterns are short-term bearish in that a stock moves lower within a descending channel, but they often form within longer-term uptrends as continuation patterns. Higher prices usually follow the descending channel pattern but only after an upside penetration of the upper trend line.
The trading strategy is to take profits between $4.65 and $4.80, with potential higher resistance at $5.15, and accumulate between $4.10 to $3.85, with a possible lower low at $3.60.
As I said in my preceding article, I recommend using about 50% of your long position to trade LIFO. It is perfectly adapted to the high volatility of the gold and silver sectors, which fluctuate wildly depending on the FED’s action on interest rates.
Warning: The TA chart must be updated frequently to be relevant. It is what I am doing in my stock tracker. The chart above has a possible validity of about a week. Remember, the TA chart is a tool only to help you adopt the right strategy. It is not a way to foresee the future. No one and nothing can.
Read the full article here


