Investment Summary
Following my last report on LeMaitre Vascular, Inc. (NASDAQ:LMAT) in August FY’23, shares have rallied another 45% into the green, along with 1) increased dividends and 2) improving fundamentals. Back then, I valued the stock at ~$85/share, roughly where it trades today.
LMAT is a long-term compounder with mouth-watering economics in my view. Management’s efforts have produced a 27% CAGR in market value and 18% CAGR in dividend growth since 2011 (Figure 1). Following the company’s most recent updates, I continue to see immense value in this name. Here I will outline updates to the investment thesis and the new risks presented in the debate.
Note: LMAT has been covered on this channel 8x by me since 2020 – see the original thesis here.
Figure 1.
Author, company filings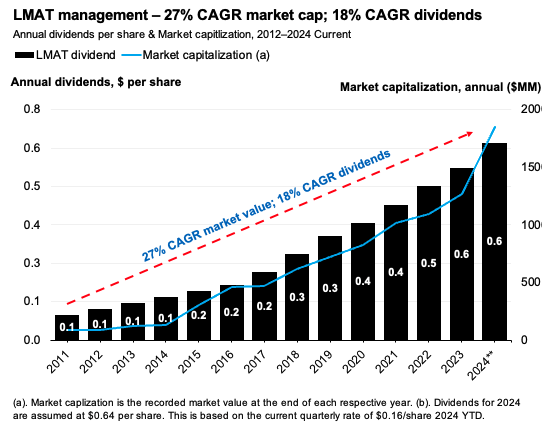
Investment Thesis
LMAT is a provider of medical devices used in treating peripheral vascular disease, end-stage renal disease, and cardiovascular disease to a lesser extent.
Founded in 1983 by vascular surgeon George LeMaitre, the company operates in an estimated $5 billion peripheral vascular device market, within which its product market is estimated at ~$800 million. It runs a diverse portfolio of vascular devices targeting the needs of vascular surgeons and, to some extent, other specialists such as orthopaedic surgeons and neurosurgeons.
I maintain buy on LMAT and I am increasing our position in the company for our portfolios here at Bernard as it 1) continues to successfully employ average sale price (“ASP”) increases to expand sales growth, 2) increases returns on capital implying greater competitive advantage period [extending to >5 years vs. 2 in FY’22], 3) hard to replicate consumer advantages in its product portfolio [seen in higher operating margins vs. industry, profit per employee vs. industry, and returns on capital vs. peers], 4) increasing sales force [aiming for >150 reps, currently 137], and 4) valuations supportive to ~$100–$105/share, driven by (i) earnings growth and (ii) potential multiples expansion. Net-net, reiterate buy.
Note: This analysis does not discuss LMAT’s dividends.
Quality business characteristics
LMAT operates within a highly specialized niche of the medical device industry, targeting the treatment of peripheral vascular disease and end-stage renal disease. The portfolio caters predominantly to surgeons using a 3-pronged strategy: (i) targeting specific “call points” [surgeries, hospitals, private practices and so forth], (ii) focusing on low-competition niche products [with high switching costs and barriers to entry – carotid shunts is a key example of this], (iii) launching new products from time to time, and (iv) expanding its direct sales force whilst mining the acquisition pipeline [its Artegraft acquisition in ‘20 moved it into adjacent biologics markets].
LMAT distinguishes itself through several quality characteristics:
-
Economics of scope – its current portfolio and Artegraft acquisition in FY’20 enabled it to consolidate manufacturing costs whilst growing sales. Since FY’22, pre-tax margin increased from 18.5% to ~20.5% in the trailing 12 months, against sales growth of a cumulative 23.6%. Operating leverage from FY’22–Q1 TTM is 1.5x – each new $1 of sales added ~$1.50 in pre-tax income growth as a testament to this.
-
Niche product focus – As mentioned earlier, the company competes in low-rivalry segments with a focused call point strategy. This approach allows it to target specific surgeries/procedures, differentiating itself from the broader peripheral vascular market – which is highly saturated by the way [it includes diabetes players alongside specific vascular products]. Versus the industry, management produces (i) higher profit per employee, (ii) >17% returns on capital [which are increasing], (iii) >20% pre-tax margins vs. 10.7% industry median, and 4) turnover on assets at par of 0.6x (Fig 2). These all indicate consumer advantages and clear points of differentiation vs. more ‘commoditized’ offerings.
-
The company was early on emerging growth trends in Southeast Asia and has seen impressive growth in regions such as Korea and China. Ex-US sales were +44% for Q1 FY’24 – a key insulator for any US economic headwinds. This international sales exposure positions it well for future upside in my view.
-
Profitability is a standout with management returning $1.90/share in owner earnings (inc. dividends) in the last 12 months [$0.125/share growth, equal to 2.3% yield] versus incremental investment of $0.38 per share – 32% incremental return on capital. This is a major driver to my investment thesis. The business’s highly intangible value is evident as (a) it requires little to no incremental capital to maintain its competitive position or grow [beyond human capital in the sales force], (b) management grows unit sales as a function of pricing power and volume [ASPs were +8% Q1 FY’24 and unit growth was +3%, for a total 14% sales growth], and (c) throws off ~$25–$35 million in FCF each rolling 12-month period.
-
As the reinvestment requirements are so low [average 11% of NOPAT since FY’22 on a 12-month basis], this has sported exceptional growth in operating earnings and dividends [operating earnings for example are poised for $45 million this year per consensus, double the $21 million of FY’19 – 16% CAGR]. These are trends I envision continuing well into the future.
Figure 2.
Company filings, Seeking Alpha, Bloomberg
Attractive valuation?
LMAT is attractively valued in my view but must be considered on a long-term horizon given 1) its currently high multiples, and 2) the extended duration of its competitive advantage period [discussed later].
Around 22 million shares make up the $1.85 billion capitalization at an EV/NOPAT of 51.2x [note: LMAT carries no debt, do EV = market value of equity capital].
In my view, current fundamentals support a valuation of ~$100–$107/share based on 1) increasing economic profit against the market cost of capital, 2) >5-year average sales growth projections of 12.1% in FY’24, and 3) 28% bottom-line growth projected vs. 7.8% 5-year average.
For it to trade there, my opinion is that (i) investors must maintain the currently high multiple on earnings and assets of the business, and (ii) the company needs to produce at least 14–15% growth in net operating profit after tax in FY’24 and ~8-9% growth FY’25.
Valuation insights
-
The market has increased the multiple paid on capital injected into the business and on post-tax earnings since FY’22 (Figure 3). From FY’21–’22, investors valued LMAT at ~5x invested capital and ~31-35x post-tax earnings, increasing this to 8.8x and 51.2x at the time of writing, respectively. This equals 46% multiple delta versus 33% growth in NOPAT.
Figure 2.
Company filings, author
- The expanded multiples are well supported fundamentally by – 1) the spread of ROIC to a market hurdle rate of 12% [reflective of long-term market averages] has widened since 2022 (Figure 3). Economic profit –calculated as ROIC less this 12% hurdle rate– increased 360 basis points to 5.1% in the TTM from 1.5% in FY’22. Economic earnings – this 5.1% scaled against LMAT’s total capital – tallied $11 million versus $3 million in ‘22, despite minimal reinvestment of earnings to grow [that’s ~$9 million in incremental economic value added], and 2) the increasing returns are from both higher turnover of capital and margin growth – capital turns increased 0.8x to 0.95x [+0.15x] as NOPAT margins loosened ~200 basis points to 18%. Investors are therefore paying more per $1 of LMAT’s capital and earnings, resulting in $41 of EV growth per $1 of incremental investment made back into operations from FY’22 to date. This, even though it issued a bit more stock since ‘22 [this is a negative point in my view]. Figure 3.
Company filings, author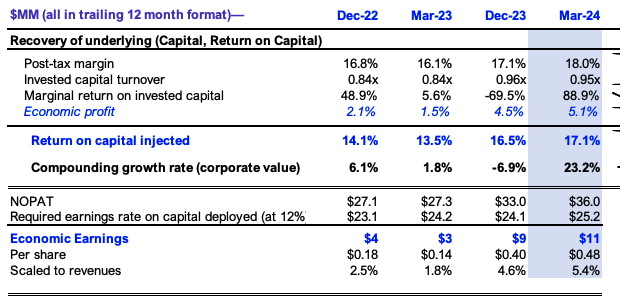
Company filings, author
-
Investors view LMAT’s competitive advantage period (“CAP”) as >5 years now vs. ~2 years in FY’22 (Figure 4). The CAP is the duration in which the market believes a firm will produce business returns above an agreed cost of equity [we use 12% here as a high threshold and because it represents the opportunity cost of investing at the long-term market averages]. The implied CAP was roughly zero from FY’22–’23, as LMAT’s ROIC compressed from ~17%–13.5%, and economic profit tightened from 5% to 1.5%. The stock price followed suit and traded flat. This is critical info as management usually has a very limited reinvestment runway to redeploy surplus funds back into the business. This increase in CAP indicates it does have the opportunities in sight. We see this in (a) the ex-US sales patterns, (b) the c.200bps post-tax margin growth, and (c) large uptick in biologics sales [+51% in Q1 FY’24].
-
Management is now investing more at higher marginal rates of return – $9.4 million at ~90% ROIIC in Q1 FY’24 vs. $3 million at 5.6% in FY’22. The extension signifies a stronger capacity to generate returns above the cost of capital, thereby warranting a higher valuation multiple. Figure 4.
Author, company filings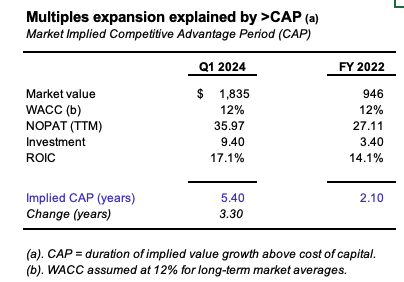
-
Current EV/NOPAT multiples are high at 51.2x, but these levels are buoyant for several reasons:
-
The “commodity P/E multiple” we assign to all equities is ~8.3x. It signifies a company earning the 12% hurdle rate on its invested capital, thus creating no economic value from its future opportunities [1/0.12 = 8.3x]. A firm trading at its commodity multiple has no future growth – it’s all the current business. The market appears to be valuing LMAT’s growth opportunities at a far higher multiple vs. FY’22, at ~55x vs. 25x under this convention (Figure 5). This stems from (a) the increased ROIC/WACC spread, and (b) the longer CAP duration from before. From FY’22–’23, my estimate was for a minimal probability of multiple growth but in FY’24 a 1.3x change isn’t unreasonable in my view. As such, there’s potential for further multiples expansion. This gets me to ~64x implied EV/NOPAT, or ~$104 per share. Whilst it may not expand this high, the point is the current multiple is well supported based on these notions.
-
Figure 5.
Author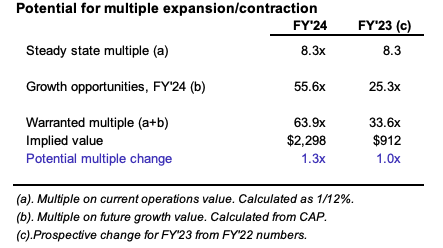
-
- Carrying the current ~51x multiple through on my forward growth estimates to FY’26E gets me to an implied valuation range of $101–$107 per share, in line with the above (Figure 6). The growth is supported by (a) exceptional marginal returns on new capita – both current and estimated, and (b) the increasing reinvestment runway for management to deploy funds into international sales, the Artegraft division, and increase the salesforce.
Figure 6.
Author’s estimates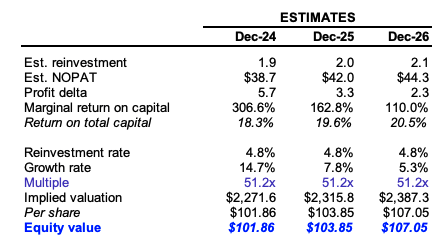
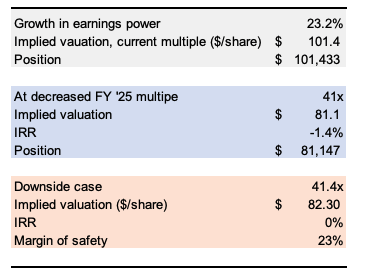
- A 5% multiple contraction with the ~15% pre-tax earnings growth still gets us to $90/share (Figure 7). The scenario where multiples increase 1.3x as in Figure 5 get us to ~18-20% upside potential with (a) +0.5% increase in shares outstanding, and (b) ~80 basis points forward dividend yield (Figure 8). My view is the company could trade as low as 41x and still be valued fairly under my forward assumptions, ~23% margin of safety (Figure 9).
Figure 7.
Author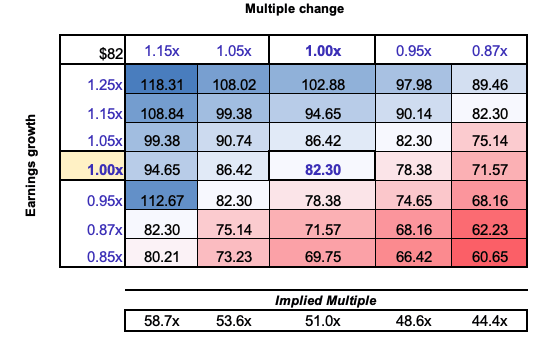
Figure 8.
Author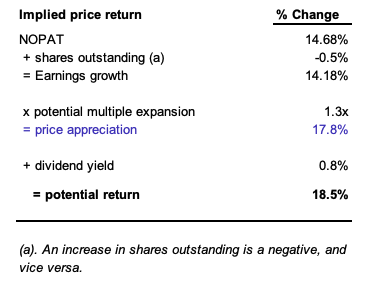
Figure 9.
. Author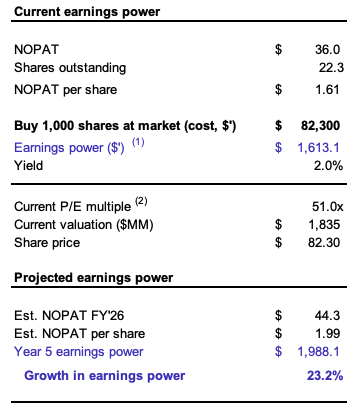
Catalysts for further price change
Several catalysts could drive LMAT’s business returns and potential multiples expansion over the next 3–5 years in my best estimation:
-
Growth of direct sales force: Management eyes a sales headcount of 150 reps by year-end FY’24. It had 137 in Q1, totalling $1.45 million revenue/rep (TTM basis). To hit the FY’24 10% sales growth guidance, it needs ~$1.4 million from each rep at 150 headcount. In my view, this adds to the value offering in high-growth regions like APAC, with sales +44% in Q1 FY’24.
-
Label expansions (by geography): Management sees 11 CE Marks by September ‘24, and the other 11 in waiting for approval by FY’25 [CE Mark is the EU regulatory approval for medical devices]. The expected CE Mark for Artegraft by Q4 FY’25 is another tailwind for EU sales in my opinion.
-
Economies in efficiency and growth: Management installed a new enterprise resource planning system for its US and ex-US businesses. This will create economies of efficiency in my view due to the improved analytics obtained. It went live in the US in Q1, and I’d be looking to FY25 for the effects of the full rollout.
-
Valuation upsides from growth + multiple expansion: As I outlined earlier, further multiple expansion potentially exists. The longer CAP, higher business returns, and ability to deploy funds back into the business at an advantage [vs. just increasing the dividend] supports this notion in my view. Management has scope to increase earnings on new capital with (i) growth in its EU sales, and (ii) further expansion of its biologics business. Don’t forget this is a company with $25 million in receivables $58 million in inventory capital against payables of ~$26 million, producing rolling FCF of a similar amount. There’s been basically no change to tangible capital in the last 3 years.
Key risks
Key downside risks include 1) a sharp multiple contraction of >23%, getting us below 41x NOPAT [41x reduces the forward IRR to 0% on my FY26E numbers, anything
Investors must realize all of these risks in full before proceeding.
In short
Investors have lifted the bid on LMAT common stock due to the company’s improving fundamental economics in my view. Further upsides are supported by 1) an increased period of competitive advantage [defined as a high spread or ROIC of a 12% opportunity cost], 2) more extensive reinvestment runway for management to deploy funds at this advantage into EU, APAC and in biologics, 3) persistence of increasing business returns, and 4) supportive valuations getting to a range of $101–$107 per share, ~23–30% upside potential at the time of writing. Reiterate buy.
Read the full article here


