|
Oakmark Fund – Investor Class Average Annual Total Returns(06/30/2024) Since Inception (08/05/1991) 12.72% 10-year 11.17% 5-year 14.68% 1-year 18.01% 3-month -3.98% Expense Ratio: 0.91% Expense ratios are from the Fund’s most recent prospectus dated January 28, 2024; actual expenses may vary. Past performance is no guarantee of future results. The performance data quoted represents past performance. Current performance may be lower or higher than the performance data quoted. The investment return and principal value vary so that an investor’s shares when redeemed may be worth more or less than the original cost. To obtain the most recent month-end performance data, visit Oakmark.com. |
What goes up… keeps going up. But we aren’t buying it.
I refer to the Oakmark Fund throughout this commentary because it is representative of our U.S. investments. The frustrations expressed about its recent performance, as well as the excitement about the opportunity ahead, however, apply to all of our U.S. funds.
The Oakmark Fund (MUTF:OAKMX) was up 6% for the first half of 2024. That far exceeds inflation and therefore achieves one of our goals: growing your capital faster than inflation erodes it. But stocks we didn’t own went up even more. During the same period, the S&P 500 Index (SP500, SPX) increased 15%, 9 percentage points more than Oakmark. We also aim to grow your capital faster than index funds. While our long-term record stacks up well, the past six months didn’t.
The first half of 2024 had three overlapping but distinct trends that we were on the wrong side of. First, giant companies were up substantially more than mere large caps. The 25-largest companies in the S&P 500 account for nearly half the index and are referred to by Morningstar as “giant” caps. Those stocks increased by 27% in the first half. The rest of the S&P 500 increased only 6%. The second trend was the strong performance of growth stocks. The Russell 1000 Growth Index increased 21% while the Russell 1000 Value Index returned only 7%, a 14-percentage point difference. The third and final trend, momentum, was unusually strong. As measured by the Morgan Stanley Momentum portfolios, stocks that performed well in the preceding year outperformed stocks that had performed poorly by 35 percentage points.
Although Oakmark is a large cap fund, it rarely has much invested in giant caps because our analysis shows that they are often priced more efficiently. The Oakmark Fund owns two giant cap stocks (Alphabet and Bank of America), and they account for only 6% of the Fund’s assets. Alphabet (GOOG,GOOGL) is Oakmark’s largest holding, making up 3.6% of our portfolio. However, Alphabet makes up even more of the S&P 500, so, the stock’s 30% return ironically hurt our relative performance.
The Oakmark Fund usually looks more like the Russell 1000 Value Index than the Russell 1000 Growth Index. But we don’t always avoid rapid growth businesses, when they sell at prices similar to slower growth businesses, we will buy them and then sell when their appropriate premium is restored. Today, however, when many stocks have very low relative P/E ratios, Oakmark looks like a traditional value fund. It ended the quarter with only 6% of its assets in companies solely in the Russell 1000 Growth Index (Alphabet and Charter Communications).
As for momentum, we often buy stocks in Oakmark after they have declined; in fact, that’s usually when we decide a stock becomes attractive. Only two Oakmark stocks are in the Morgan Stanley Momentum portfolios: First Citizens (FCNCA) and Corebridge (CRBG). Those two names account for only 3% of Oakmark assets.
At the intersection of the three tailwinds, giant cap growth companies that performed well in 2023 continued to perform well in 2024. At the convergence of the three headwinds, the large cap, slower growth companies that didn’t perform well in 2023 continued to underperform in 2024. So, you can see why we didn’t keep up.
For high-priced growth stocks to continue outperforming, they must either maintain their growth rates long into the future or maintain their high relative P/E ratios. Oakmark uses a longer time horizon than most value investors, but we won’t underwrite either above-average growth or an above-average P/E beyond seven years. Our belief that many growth stocks today are fully valued could be proven wrong if these businesses can sustain their advantage for longer than businesses have in past technology transformations.
There have been two technologies in my career that seem similar to the artificial intelligence (‘AI’) excitement boosting tech stocks today – computers and the Internet. When I was in business school in 1980, there was so much market interest in the computer manufacturers that IBM was the largest market cap company, and the industry was referred to as “IBM and the Seven Dwarfs” (Burroughs, UNIVAC, NCR, Control Data, Honeywell, General Electric and RCA). Suffice it to say that profits from computer manufacturing disappointed for all eight companies. Then in 2000, amidst “dotcom” hysteria, the largest cap Internet companies were Cisco (CSCO), America Online (AOL) and Yahoo!. AOL and Yahoo! ended up nearly worthless, and Cisco, at a lower share price than in 2000, has lost 80% relative to the S&P 500. We think these results should give pause to anyone believing the AI winners have already been determined.
Another argument against today’s wide P/E spread narrowing is that the decline in the number of value investors is preventing mean reversion. In other words, today’s investors generally don’t sell stocks when they get expensive or buy when they get cheap, so price and value aren’t forced to converge. That was also a popular view during the “dotcom” bubble when investors sold underperforming value funds to buy growth funds.
What finally popped the “dotcom” bubble? Even with hindsight, there is no definitive answer. I think supply and demand eventually forced stock prices toward fair value. Expensive stocks like AOL issued shares to buy more modestly valued Time Warner. If AOL was overvalued and Time Warner was fairly valued, issuing shares increased AOL’s per-share value and simultaneously decreased its share price. Supply also came from record IPO activity, mostly in the overvalued technology sector.
Likewise, undervalued companies were not helpless. They redirected capital to share repurchase. Reducing shares outstanding at a discount to fair value increased the value of their remaining shares. We see examples today of low P/E companies radically altering investments to fund share repurchases. Oakmark’s second-largest holding, General Motors (GM), for years traded around $40 and earned about $6. Then GM announced the repurchase of 20% of its outstanding shares and followed that last month with another 11%. The result is consensus 2025 EPS for GM has risen 25% while the auto industry average declined nearly 10%. Not coincidentally, GM has been one of our best performing stocks this year.
Also, consider a popular stock, GameStop (GME), issuing shares to pay down debt. That may have reduced the stock price, but it also increased the probability of avoiding bankruptcy.
Companies don’t need to wait for investors to close price-to-value gaps. By using share repurchase and issuance to maximize per-share value, they can accelerate the process.
The dominance of growth stocks has also changed the composition of market indices. Morningstar creates a growth/value score1 for every stock based on metrics that correlate with either low valuation or high growth. They then determine portfolio scores by taking an asset weighted average of the underlying stocks. A portfolio with a score under 125 is considered value, a portfolio over 175 is classified as growth, and anything in between is considered blend. The S&P 500 currently scores as a growth portfolio with a score of 192. Prior to this year it had always been blend. As of the end of June the Russell 1000 Value Index scores as value at 109, and the Oakmark Fund, at 73, has its lowest score ever. The last time Oakmark was below 80 was in 2000 at the end of the Internet boom.
Typically, the Oakmark portfolio has scored between the Russell 1000 Value Index and the S&P 500 Index. That’s why, when the S&P 500 outperformed the Russell 1000 Value, Oakmark usually performed between the two. This year, Oakmark is much deeper in value territory than the Russell 1000 Value because we find low P/E stocks, many at barely half the market multiple, unusually attractive. The Russell 1000 Value has underperformed the S&P 500 year-to-date and Oakmark has been slightly worse.
The methodology Russell uses for its value index increases its current P/E. One might think the Russell 1000 Value Index is composed of 1000 cheap stocks. It is not. Russell takes the largest 1000 market cap companies and ranks them in order, based on a value metric (P/B) and a growth metric (sales). The growthier stocks generally go into the Russell 1000 Growth Index, and the value stocks go into the Russell 1000 Value Index. Stocks that fall somewhere in the middle can be split across both indexes, such that each index contains half the market cap of the Russell 1000. The scores are recalculated annually, and the indices are rebalanced at the end of June.
Because of the strong performance of a handful of high-growth, giant technology stocks, many growth-oriented, non-technology stocks are being pushed into the Russell 1000 Value Index. For example, at the end of June, Accenture (ACN) and Home Depot (HD) were reclassified as value stocks. That didn’t happen because their stocks got cheap. Indeed, Accenture trades at 25 times expected earnings. It happened because, over the past year, Accenture and Home Depot didn’t increase as much as tech growth stocks. At Oakmark, we don’t increase our value estimates when stocks we don’t own get more expensive. So, Oakmark’s P/E has fallen well below the Russell 1000 Value. The average forward P/E for Oakmark is 11 times compared to 15 for the Russell 1000 Value and 21 for the S&P 500, despite expected EPS growth that only slightly trails the S&P 500.
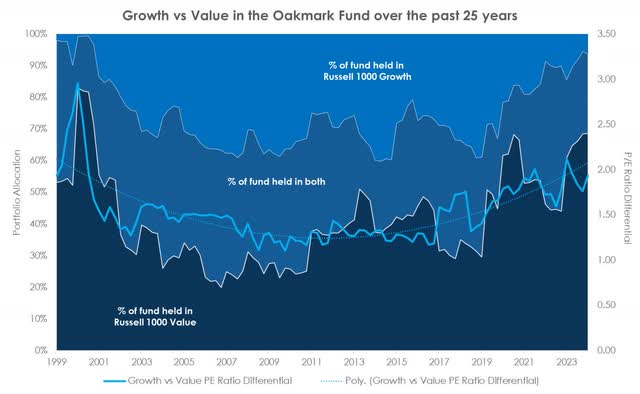
The following chart shows the percentage of Oakmark’s portfolio invested in stocks that are in the Russell 1000 Value, Russell 1000 Growth, and stocks split between the two. It also shows the ratio of the Russell 1000 Growth average P/E to the Russell 1000 Value P/E. You can see that the only time in the past 25 years that growth was relatively more expensive was in 2000 before the “dotcom” bubble popped. It also shows that Oakmark’s ownership of pure value stocks reached 80% of the portfolio in 2000, then fell to only a third as growth underperformed, but now has climbed to nearly 70%.
Data source: FactSet, June 1999- June 2024
The Oakmark Fund trailed the market by more in the first half of 2024 than all but four half-year periods in its history. The previous top five included the “dotcom” boom (three times), the Great Financial Crisis (‘GFC’), and the Covid shutdown. The silver lining is that those periods led to strong relative performance after the “dotcom” bubble popped, the economy emerged from the GFC, and Covid fears abated, as shown in the following tables.
Periods of largest underperformance relative to S&P 500
|
Start Date |
End Date |
Relative performance (‘bps’) |
|
6/30/1999 |
12/31/1999 |
-2704 |
|
6/30/1998 |
12/31/1998 |
-1227 |
|
12/31/2019 |
6/30/2020 |
-1133 |
|
12/31/1997 |
6/30/1998 |
-1073 |
|
6/30/2007 |
12/31/2007 |
-779 |
Subsequent periods of large outperformance
|
Start Date |
End Date |
Relative performance (‘bps’) |
|
Dotcom |
||
|
6/30/2000 |
12/31/2000 |
2842 |
|
12/31/2000 |
6/30/2001 |
2400 |
|
6/30/2001 |
12/31/2001 |
640 |
|
12/31/2001 |
6/30/2002 |
862 |
|
Great Financial Crisis |
||
|
6/30/2008 |
12/31/2008 |
443 |
|
12/31/2008 |
6/30/2009 |
825 |
|
6/30/2009 |
12/31/2009 |
735 |
|
Covid |
||
|
6/30/2020 |
12/31/2020 |
974 |
|
12/31/2020 |
6/30/2021 |
1056 |
|
Data source: Morningstar Direct. |
||
Throughout our history, in good markets and bad, we’ve suggested shareholders rebalance their portfolios. After stock and bond allocations are set, the market moves a portfolio away from those targets. Additionally, the risk increases because the portfolio becomes too heavily invested in the assets that went up. We encourage restoring balance by selling some of what went up and buying what went down. The same can be done between growth and value. Since the beginning of 2023, growth has outperformed value by 53 percentage points, meaning exposure to growth has risen a lot. (And, as pointed out above, even S&P Index funds have become growth funds.) At a minimum, large moves provide good opportunities for rebalancing to reduce risk. And if we’re right about the best opportunities in today’s market, it can also increase returns.
In the investment business the line between early and wrong can be very blurry, and which side we are on today will only be obvious with hindsight. The market has clearly made us look wrong so far this year, but we’re excited by the relative cheapness of the Oakmark Fund and see similarities with previous periods when our poor relative performance was followed by substantial outperformance of index funds. Thank you for your patience.
William C. Nygren, CFA
Portfolio Manager
|
Footnotes 1 Refers to Morningstar Raw Value-Growth score; data based on most recent available, which is May 31, 2024. The securities mentioned above comprise the following percentages of the Oakmark Fund’s total net assets as of 06/30/2024: Accenture 0%, Alphabet Cl A 3.6%, AOL 0%, Bank of America 2.3%, Burroughs 0%, Charter Communications Cl A 2.2%, Cisco Systems 0.8%, Control Data 0%, Corebridge Financial 1.0%, First Citizens Bcshs Cl A 1.7%, GameStop 0%, General Electric 0%, General Motors 2.8%, Home Depot 0%, Honeywell 0%, IBM 0%, NCR 0%, RCA 0%, Time Warner 0%, UNIVAC 0% and Yahoo 0%. Portfolio holdings are subject to change without notice and are not intended as recommendations of individual stocks. To obtain a full list of the most recent quarter-end holdings, please visit our website at The Oakmark Funds | Global Asset Manager | Value Investing Redefined or call 1-800-OAKMARK (625-6275). The information, data, analyses, and opinions presented herein (including current investment themes, the portfolio managers’ research and investment process, and portfolio characteristics) are for informational purposes only and represent the investments and views of the portfolio managers and Harris Associates L.P. as of the date written and are subject to change and may change based on market and other conditions and without notice. This content is not a recommendation of or an offer to buy or sell a security and is not warranted to be correct, complete or accurate. Certain comments herein are based on current expectations and are considered “forward-looking statements.” These forward looking statements reflect assumptions and analyses made by the portfolio managers and Harris Associates L.P. based on their experience and perception of historical trends, current conditions, expected future developments, and other factors they believe are relevant. Actual future results are subject to a number of investment and other risks and may prove to be different from expectations. Readers are cautioned not to place undue reliance on the forward-looking statements. The price to earnings ratio (“P/E”) compares a company’s current share price to its per-share earnings. It may also be known as the “price multiple” or “earnings multiple”, and gives a general indication of how expensive or cheap a stock is. Investors should not base investment decisions on any single attribute or characteristic data point. The Price to Book Ratio is a stock’s capitalization divided by its book value. The Price to Value for a stock is the ratio of the current stock price divided by the intrinsic value as calculated by the investment team’s valuation model. The Price to Value for a portfolio is the weighted average of the price to value for each stock in the portfolio. Initial Public Offering (“IPO”) is the first sale of stock by a company to the public. EPS refers to Earnings Per Share and is calculated by dividing total earnings by the number of shares outstanding. The Morgan Stanley US Momentum portfolios are long and short baskets that select the top and bottom 15% of the most liquid stocks, respectively from the Russell 3000 index based on 12 month returns. The baskets are designed to be highly liquid and rebalanced monthly where stock weights are subject to a 2% maximum and aggregate sector weights to a 25% maximum. The S&P 500 Total Return Index is a float-adjusted, capitalization-weighted index of 500 U.S. largecapitalization stocks representing all major industries. It is a widely recognized index of broad, U.S. equity market performance. Returns reflect the reinvestment of dividends. This index is unmanaged and investors cannot invest directly in this index. Russell 1000® Growth Index is an unmanaged index that measures the performance of the large-cap growth segment of the U.S. equity universe. It includes those Russell 1000® companies with higher price-tobook ratios and higher forecasted growth values. This index is unmanaged and investors cannot invest directly in this index. The Russell 1000® Value Index measures the performance of the large-cap value segment of the U.S. equity universe. It includes those Russell 1000® companies with lower price-to-book ratios and lower expected growth values. This index is unmanaged and investors cannot invest directly in this index. The Oakmark Funds’ portfolios tend to be invested in a relatively small number of stocks. As a result, the appreciation or depreciation of any one security held by the Fund will have a greater impact on the Fund’s net asset value than it would if the Fund invested in a larger number of securities. Although that strategy has the potential to generate attractive returns over time, it also increases the Fund’s volatility. Investing in value stocks presents the risk that value stocks may fall out of favor with investors and underperform growth stocks during given periods. All information provided is as of 06/30/2024 unless otherwise specified. Before investing in any Oakmark Fund, you should carefully consider the Fund’s investment objectives, risks, management fees and other expenses. This and other important information is contained in a Fund’s prospectus and summary prospectus. Please read the prospectus and summary prospectus carefully before investing. For more information, please visit Oakmark.com or call 1-800-OAKMARK (1-800-625-6275). Harris Associates Securities L.P., Distributor, Member FINRA. Date of first use: 07/08/2024 QCM-3893WCN-10/24 |
Original Post
Editor’s Note: The summary bullets for this article were chosen by Seeking Alpha editors.
Editor’s Note: This article discusses one or more securities that do not trade on a major U.S. exchange. Please be aware of the risks associated with these stocks.
Read the full article here


