Introduction
This article highlights the most significant week for the markets that we have seen in more than 2 years. In addition we see strong similarities between 2024 and the peak of 2021. Building on my prior articles and podcasts referenced below, this article looks at 3 main themes for you to consider:
- Sahm Recession Rule was triggered on Friday for the first time in a non-Covid pandemic economy since 2008.
- Pullback warnings from Fed rate and worsening economic data.
- Mega Caps with strong similarities to 2021 peak and a review of AAPL, MSFT, NVDA below.
Week 31 of 2024 was one for the record books. Last week delivered both the best move higher for the S&P 500 (SPX) (SPY) and the sharpest decline of the year. The major indices continue in bearish stair steps from the market peak in July driven by pullbacks in the mega cap stocks.
FinViz.com VMBreakouts.com
The events that contributed to the enormous swing this week included:
- Major Q2 earnings misses and beats in AAPL and META
- Sharp contraction in ISM Manufacturing data back to November lows
- Spike in unemployment levels to 4.3%
- Sahm Rule Recession signal triggered
- News that Warren Buffett has increased record cash holdings again with nearly 50% sale of Apple stock and Bank of America (BAC) sales
Sahm Recession Rule Triggered
Let’s start with the Sahm Rule developed by economist Claudia Sahm that states:
the economy is in recession when the unemployment rate’s three-month average is a half percentage point above its 12-month low.
Back in early July, one of our members brilliantly forecasted the Sahm Rule getting closer to a recession signal on weakening labor growth. This early warning was actually triggered on Friday for the first time since 2008 by the spike to a 4.3% unemployment rate on Friday.
Real Investment Advice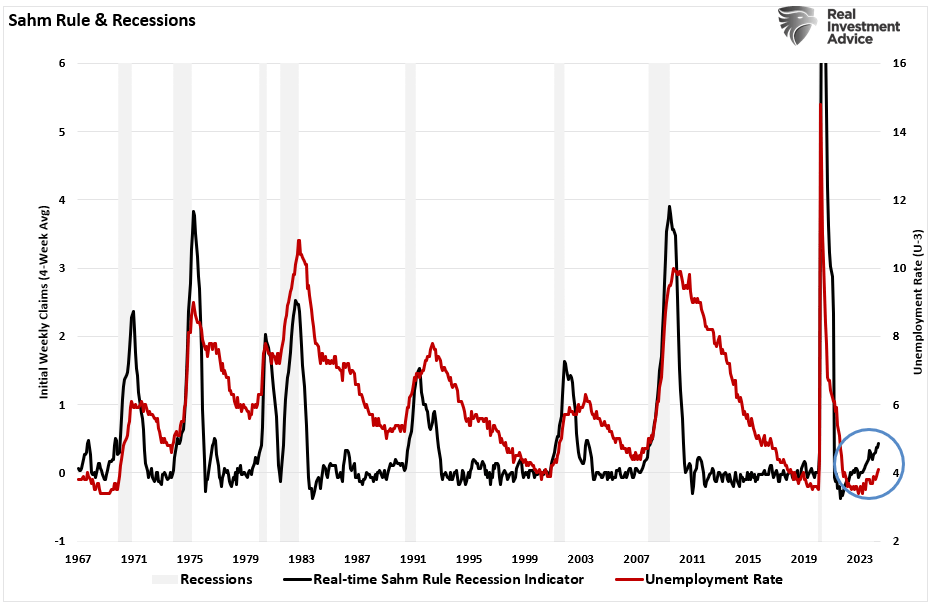
As the chart from 1967 illustrates, a breakout in unemployment above this level most often moves sharply higher for several months before recovering. Recession indicators are among the most serious market signals and usually require high significance in the data in order to be triggered.
Economic Pullback Warnings
On Thursday the ISM Manufacturing index missed badly and contracted to the lowest levels since last November as shown below. Not only was this contraction to the lowest levels in 7 months, but the economists’ forecast missed badly calling for an increase in manufacturing to 48.8 above prior months.
TradingEconomics.com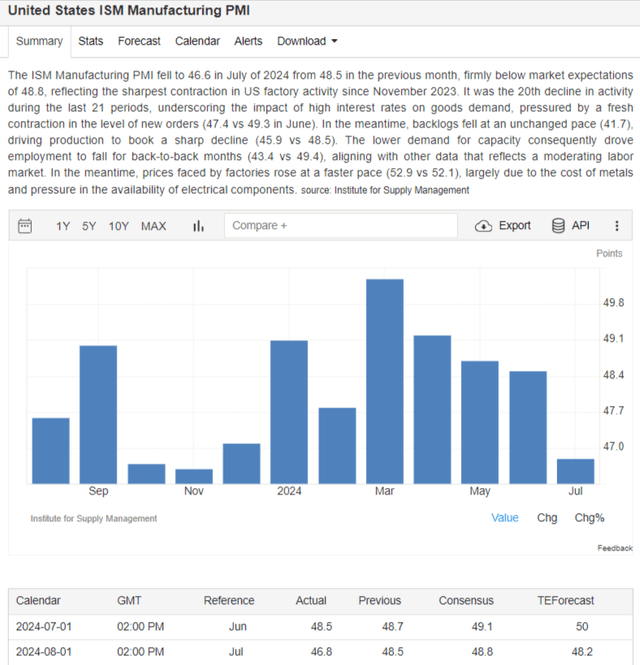
Back in July we saw the largest decline in Existing Home Sales in more than a year back to the lowest levels since 2023. This also shows the extreme negative impact that the high interest rates are having on borrowers.
x.com/jdhenning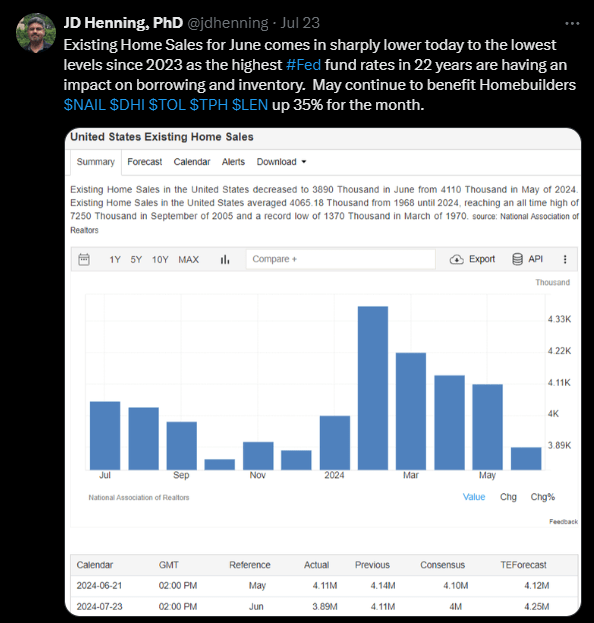
There are other important macro economic factors to consider, but I highlight these two to show the adverse conditions on U.S. consumers and producers.
Fed Funds Rate pattern
As has become well known by now and often repeated these days:
It isn’t the hiking that leads to a market downturn, but it’s the period of time when the Federal Reserve keeps the rates higher for longer that has led to market corrections every single time after a rise in the Fed funds rate. ~ JD Henning, January 2024 Podcast
Haver Analytics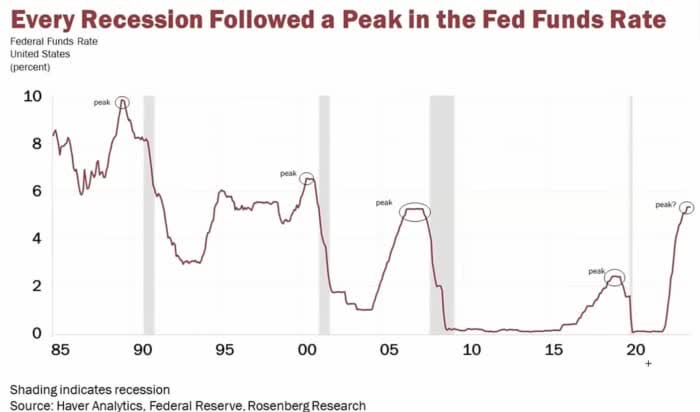
With the odds of a Fed rate cut above 99% for September and calls, even this week, for an emergency rate cut to rescue markets, we are clearly at the peak of the Fed’s record rate hiking cycle.
- Fed Holds Rates Unchanged for a 7th Time After Record 11 Rate Hikes
Now the Fed has held rates at the highest levels in over 22 years through eight different Fed meetings after the fastest and largest rate hiking cycle since 1977.
Real Investment Advice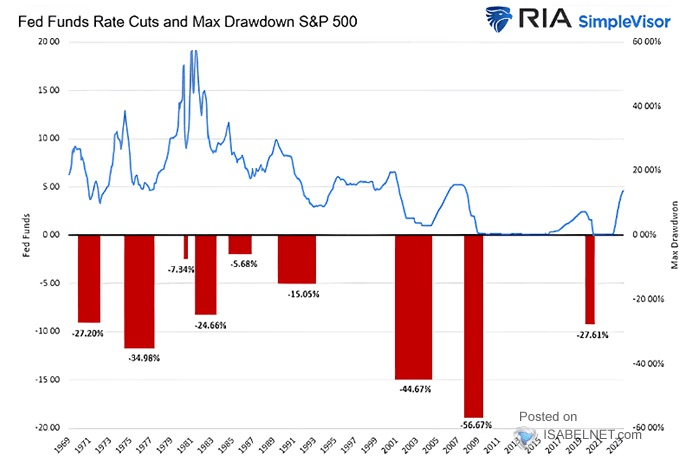
Higher rates may reduced inflation, but they certainly reduce loan accessibility needed to fuel economic growth and cause increases in costs to businesses. It will not be surprising to see another pullback in markets that has occurred after every major Fed rate hiking cycle over the past 60 years.
So where are the markets headed in 2024?
As I wrote before in my outlook articles with comparisons back to 2021:
In 2024, there are things happening that we have not seen in decades. One is we have the largest ongoing quantitative tightening program from the Federal Reserve that we’ve seen — ever seen, and combined with the highest interest rates, Fed funds rates in 22 years. ~ JD Henning, January Podcast
Fed Balance Sheet tightening liquidity back to the lowest level since February 2021 at $7.4 trillion. Again more similarities and references to 2021.
Bloomberg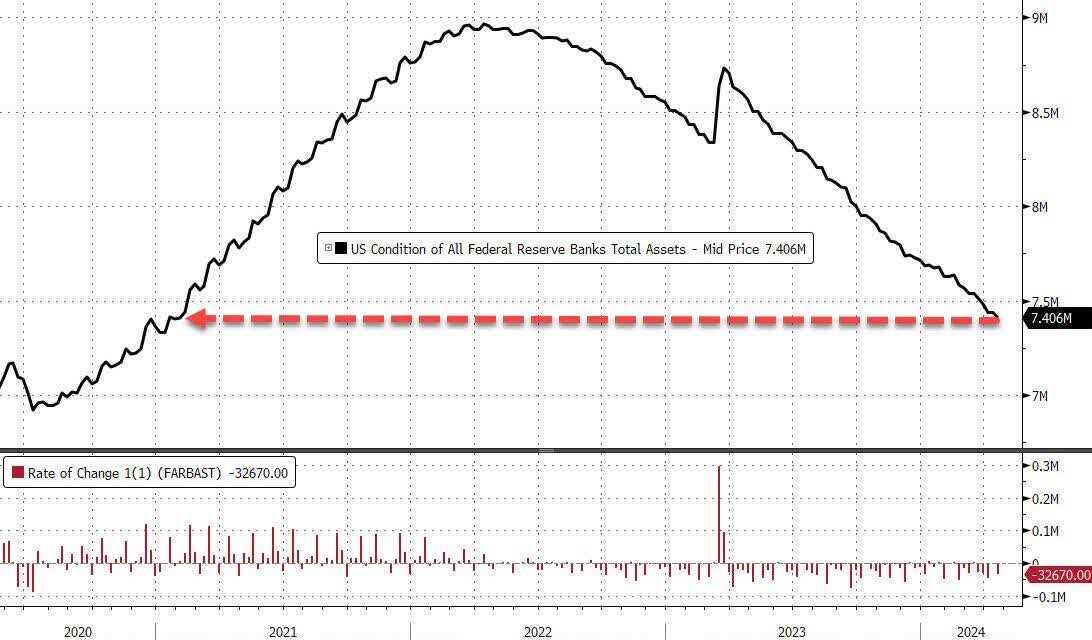
Just as the increase in money supply and quantitative easing contributes to major growth and expansionary spending behavior, so too does the contraction of these stimuli contribute to the opposite economic conditions. So if the Fed continues to aggressively remove all the measures it used to rescue markets, we can expect some significantly negative reactions in the market that we have not seen in a few years.
VMBreakouts.com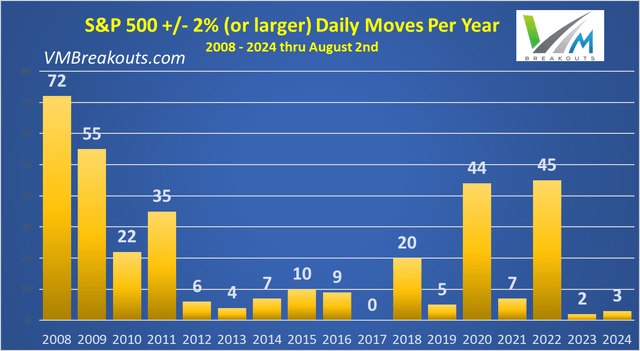
It would not be unexpected to see many more +/-2% moves in the coming days for the S&P 500 as I have detailed for some time. In 2020 several of those moves were greater than +/- 9% in one day.
VIX volatility index saw the largest one-day gain +28.8% in more 2 years on Friday and spiked above the negative channel with extremely high volumes.
FinViz.com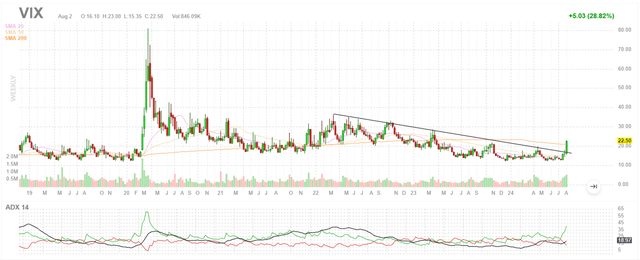
Over the years, I have studied and written at length about the quantitative tightening program and its market effects since its first major implementation in 2018. In short, this Fed balance sheet tightening drains liquidity and at some threshold (possibly at the current levels back to 2021 levels) creates significant market volatility as it did in 2018.
Warnings from Berkshire Hathaway
As I have been sharing since November when Warren Buffett first increased his cash holdings to the highest levels in the history of Berkshire (BRK.A) (BRK.B), those cash holdings have only increased more rapidly for the past 3 quarters:
Zerohedge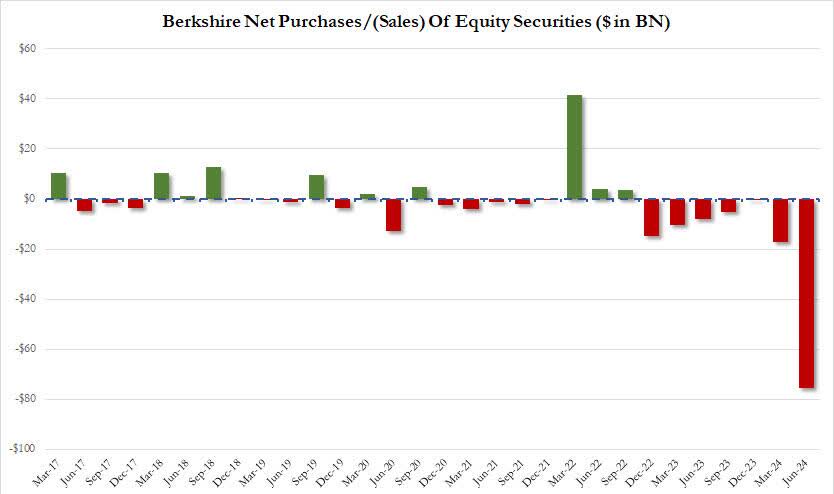
Berkshire Hathaway’s cash pile swelled to a record $276.9 billion last quarter as Warren Buffett sold big chunks in stock holdings including Apple.
The Omaha-based conglomerate’s cash hoard jumped significantly higher from the previous record of $189 billion, set in the first quarter of 2024. The increase came after the Oracle of Omaha sold nearly half of his stake in Tim Cook-led tech giant in the second quarter.
Berkshire has been a seller of stocks for seven quarters straight, but that selling accelerated in the last period with Buffett shedding more than $75 billion in equities in the second quarter. ~ NBC
Public Domain
It is possible that Berkshire Hathaway is completely wrong, however the continuous removal of many billions of dollars in investment capital has a significant effect on the valuation and operation of these companies. I would not bet against the enormous volume of selling that continues to show up in some of the most heavily weighted stocks on the indices.
What do the largest stocks in the world tell us?
One of the best ways to view market conditions and money flows is a quick check of the three largest market cap stocks in the world. As I have written about previously, the similarities to 2021 give me strong reason for caution in 2024. In particular, the Mega Cap stocks and valuations are at extreme levels across different metrics that preceded prior declines.
The skew into the Mega Cap stocks is at the most extreme levels relative to the equal weighted S&P 500 since 2008. Relative to the broad market this Mega Cap skew is the most extreme it has ever been and I trust that could greatly benefit the small caps in the future:
Yardeni.com 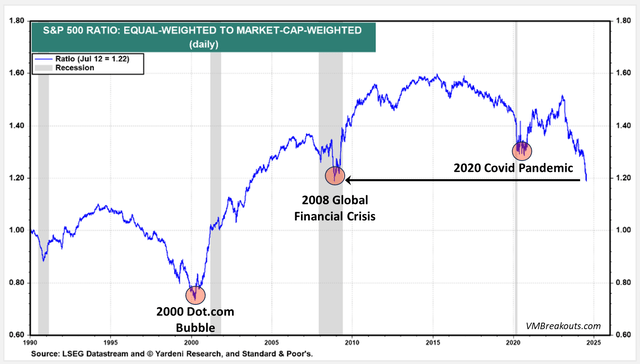
The BMO REX MicroSectors FANG+ Index 3X Leveraged ETN (FNGU) chart is an important fund for analyzing the 10 largest stocks in the US market: (META), (GOOGL), (MSFT), (SNOW), (AMZN), (AAPL), (NFLX), (NVDA), (TSLA), (AMD). Much like late 2021 we are seeing an early pullback in the Mega Cap giants. It is quite possible we could see more months of rallies and selloffs again much like we saw in 2021 before investors capitulated in 2022.
FinViz.com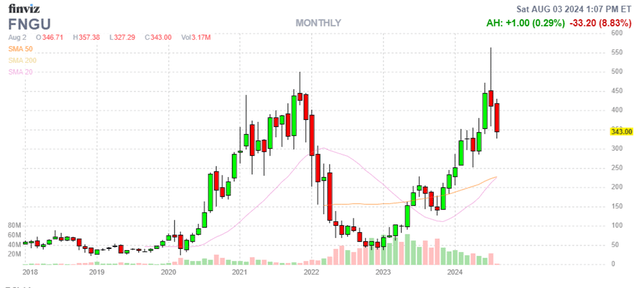
These Mega Cap declines are quite significant but do not even include Intel (INTC) that saw the largest daily decline in 50 years following the earnings miss on August 1st after the close:
FinViz.com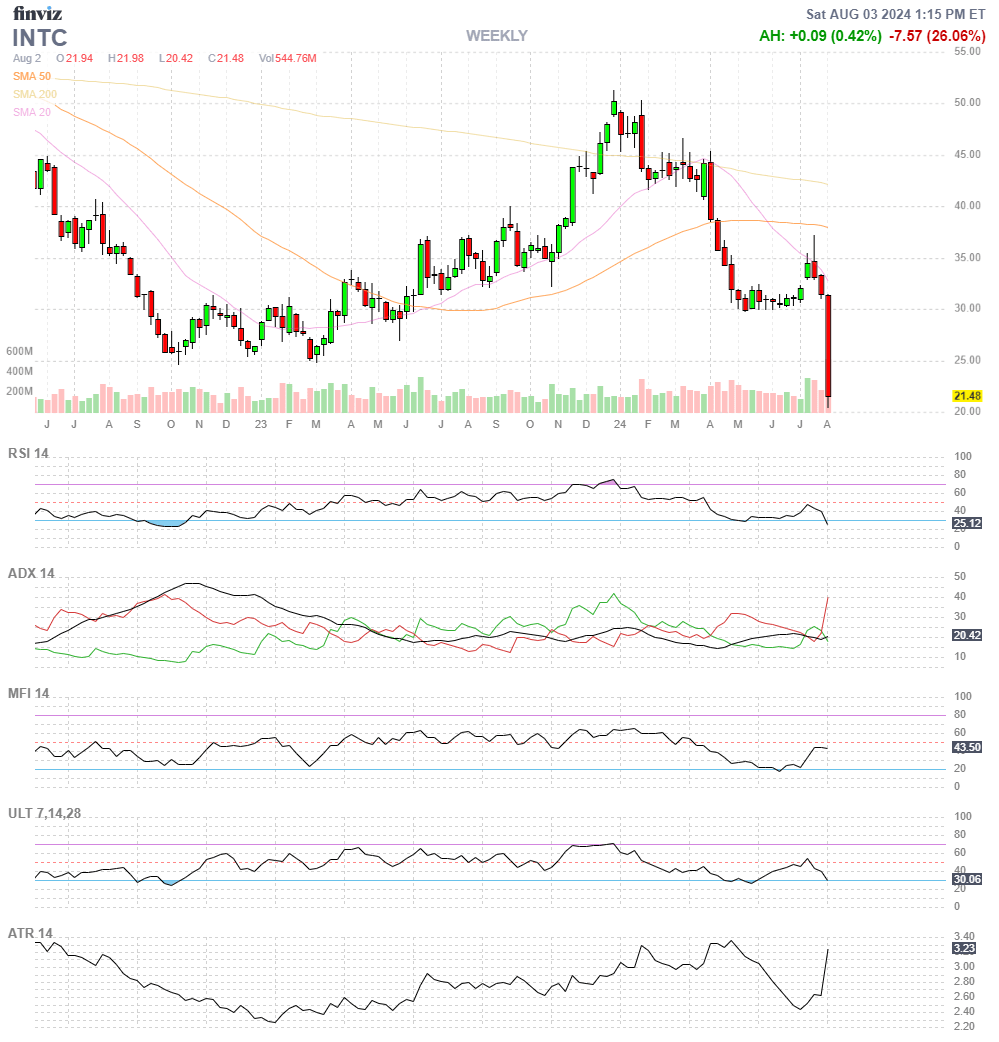
How does NVIDIA look?
NVIDIA (NVDA) has been in Segment 6 negative acceleration since mid-July and is likely to find next strong support around $96/share level in the coming days.
www.vmbreakouts.com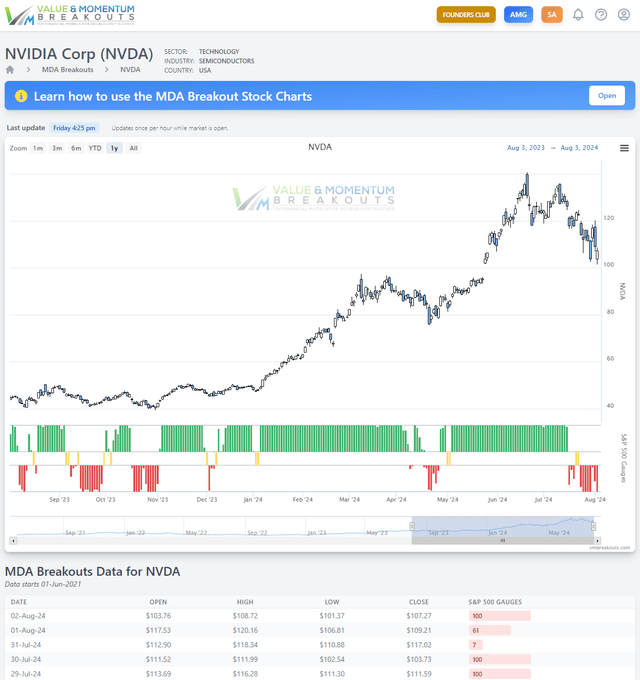
Comparing the monthly and weekly NVDA charts between 2021 and 2024 shows more strong similarities below. Back at the peak of 2021 many analysts were predicting extremely large gains for NVDA. All of them were totally correct, however, not before experiencing a -67% decline in the stock through 2022.
FinViz.com VMBreakouts.com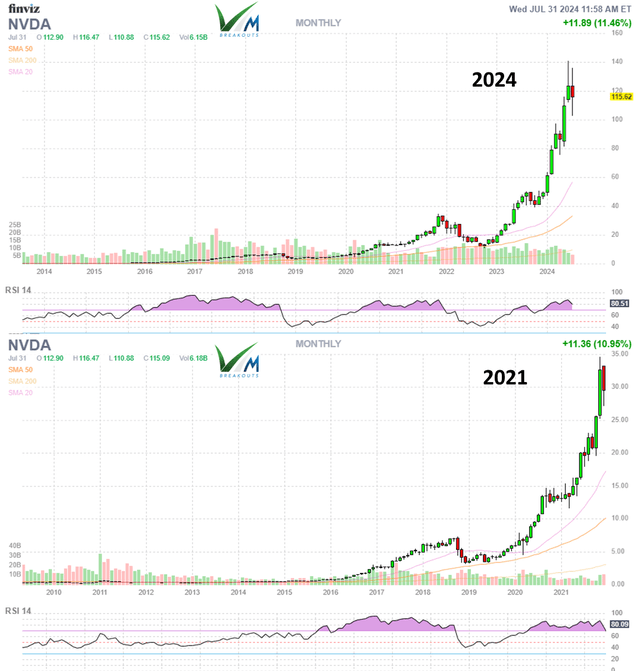
On the weekly chart NVDA is likely to retest $96/share. If similarities continue to follow 2021 we could see large bearish stair steps with gains over 2% in a day, but continued lower lows through the rest of the year to lower valuations.
x.com/jdhenning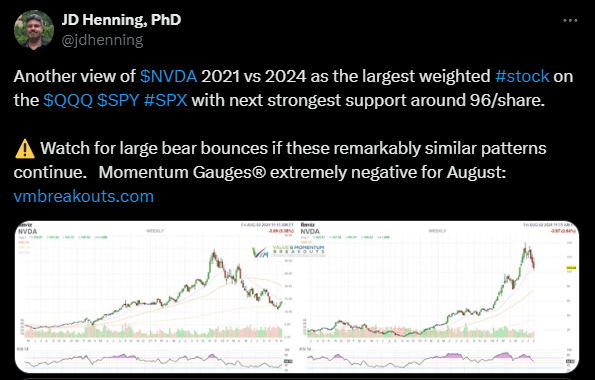
How does Microsoft look?
Back in 2022 the Microsoft (MSFT) monthly chart declined -34% YTD reaching the lowest levels since 2020. Current levels are also in technical overbought conditions with declining inflows that could see a move back to $350/share but still in the positive monthly channel.
FinViz.com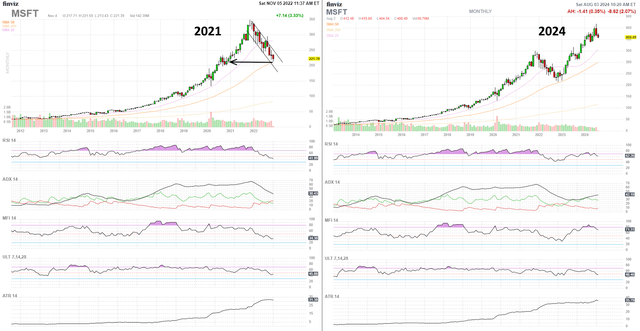
There is a strong probability that MSFT will soon retest the 20 day moving average, if not the 50 day moving average from these short term overbought levels.
How does Apple look?
Apple (AAPL) is in technical breakdown below the strong positive channel from the Q1 earnings breakout. Once again the company beat on earnings and carries an enormous cash balance that it is using to fulfill the prior quarter promise of a $110 billion stock buyback.
FinViz.com VMBreakouts.com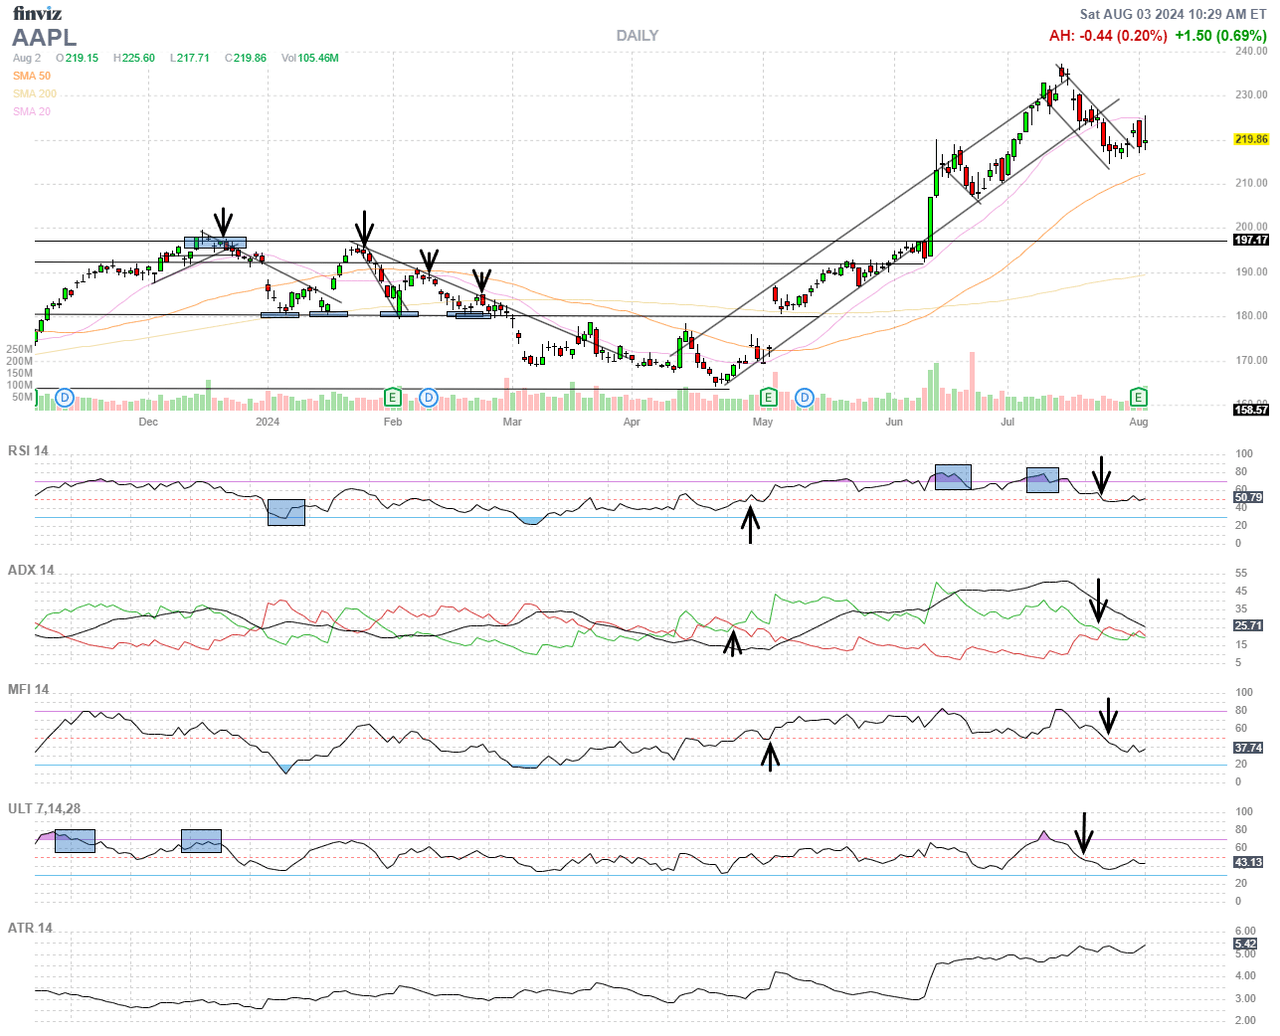
However, the net MFI outflows continue and as discussed previously, Berkshire Hathaway has cut nearly 50% of its holdings in Apple with a massive reduction that may offset the corporate buyback flows in the short term. In the latest institutional holdings report on the Nasdaq website we can see that Blackrock has reduced holdings in Apple by even more than Berkshire in the recent quarter. Decreased positions are outpacing the increased positions for a large net outflow from Apple currently.
Nasdaq.com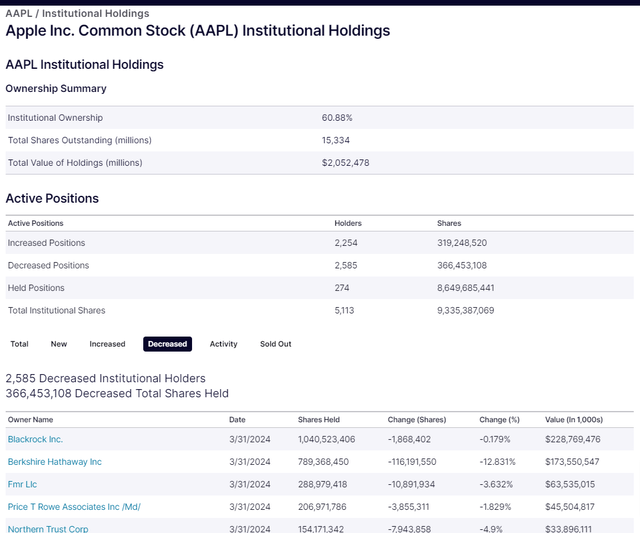
Conclusion
As long time members and readers of my articles know, the Technology sector is by far the most heavily weighted and significant sector on the corporate Market Indices of Nasdaq and the S&P 500. No analysis of the markets is complete without a look at the Technology sector gauges back to the November 2021 topping signal. The yellow index line is the Direxion Daily Technology Bull 3X Shares (TECL) ETF overlaid with arrow signals from the Technology momentum gauges.
The Weekly Technology gauges have turned negative after 3 weeks of rising negative momentum and a Daily Technology gauge negative signal on July 24th, eight trading days ago. Current negative values are at 112 and reached a high of negative 387 back during the 2022 market selloff.
Technology Momentum Gauges weekly chart from 2021
www.vmbreakouts.com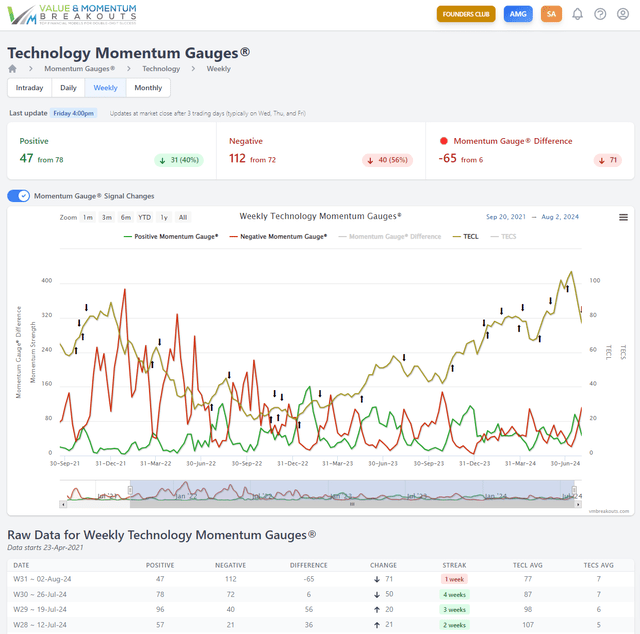
The record reversals and signals this week as detailed above may be giving us some critical warnings. In fact, all the prior market corrections have only ever occurred while the Technology Sector and S&P 500 Momentum Gauges were negative as they are now.
S&P 500 Weekly Gauges in only the 3rd negative signal since September 2023.
www.vmbreakouts.com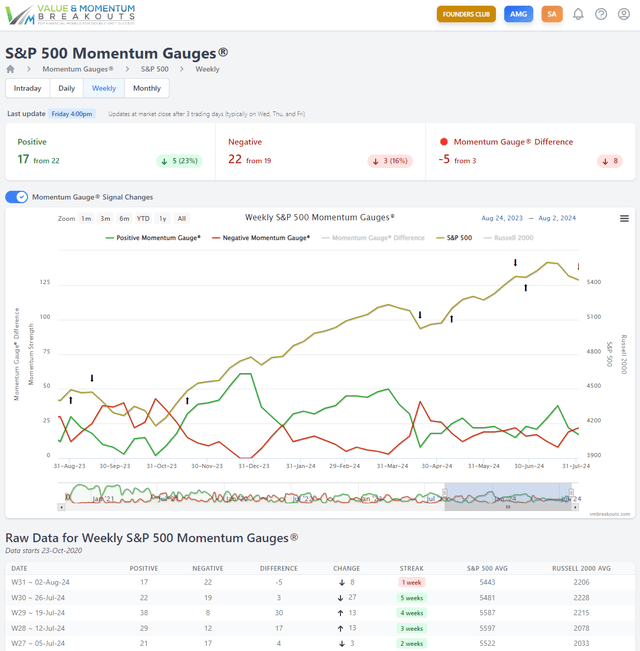
However, no indicators are perfect and should always be considered carefully on an ongoing basis as you make your investing decisions.
I hope this analysis benefits your decisions and I wish you the very best!
JD
Read the full article here


