

 Q4 2025 Earnings Call Transcript")


In a recent analysis, we discussed that Stephen Miran and follow-up appointees are likely to take the Fed Funds rate lower. This, of course, has implications for much of the investment universe, but this article will be focused on the individual securities that stand to benefit the most. There are three main topics we want to cover:
- Will cuts to the short end of the interest rate curve impact the long end?
- Investment dollars pushed out the risk curve
- Interest expense savings of capital-intensive companies
Curve Dynamics
The yield curve is typically considered to be upward sloping, with a “normal” curve looking approximately like a graphed square root function. Longer duration bonds generally provide higher yields as compensation for greater duration risk.
In recent years, however, we have had some atypical yield curve shapes. It was inverted for a while, where the long end had a lower yield than the short end. Presently, it has a normal upward sloping shape from the 2-year to 30-year, but still has a bit of oddity where very short-term rates pay higher yields than the two-year Treasury.
S&P Global Market Intelligence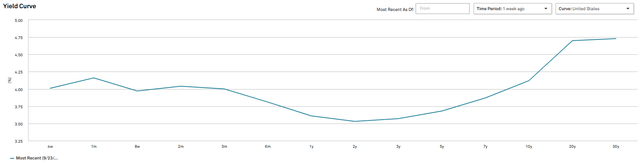
The short end of the curve is essentially forced to be above 4% because of the Fed Funds rate.
S&P Global Market Intelligence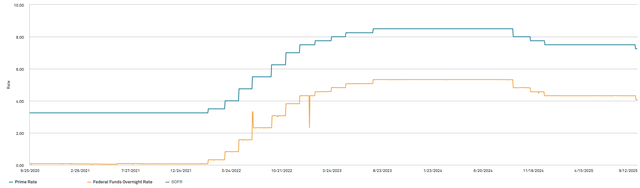
In September, the Fed lowered the Fed Funds rate to a range of 400 to 425 basis points.
When the Fed cuts like this, it almost immediately reduces the short end of the yield curve in parallel with the cut.
The impact of a Fed cut on the longer end of the yield curve is less clear, and there is a good bit of debate on what will happen.
Some believe the long end will be unaffected because it is already somewhat steep relative to the 2-year. Thus, the short end would simply come down however many basis points were cut, and the long end would remain.
I see this to be among the plausible scenarios. However, I think it is more likely that the long end will come down, just to a lesser degree.
Perhaps for each 50 basis points of cuts, the 10-year and 30-year would drop something like 20 basis points. I think it will be a consequence of capital forced out on the duration curve.
Presently there is a glut of capital in money market funds. $7.3 trillion is an unprecedented level for capital in money market funds.
FRED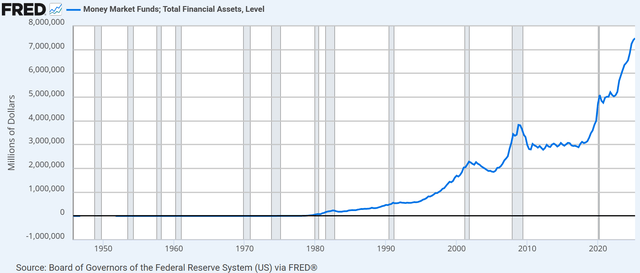
I believe much of this capital is here to take advantage of unusually high short-term rates.
After years of getting almost no return on cash held in money market funds, the 4%+ available today feels excessively lucrative.
Crane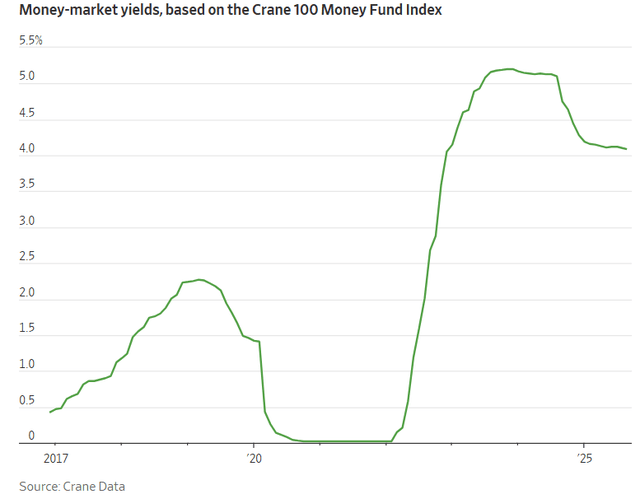
A 4% return that is close to risk free and almost fully liquid is a great deal. Market participants recognize this and have crowded in.
In a free market, crowding into a tranche would naturally lower the yield, but it is being artificially held up by the Fed Funds rate. The Fed Funds rate more or less dictates the minimum yield for the short end of the curve.
As evidence that there is a disproportionate amount of capital in short-term funds, observe the overall money supply below.
FRED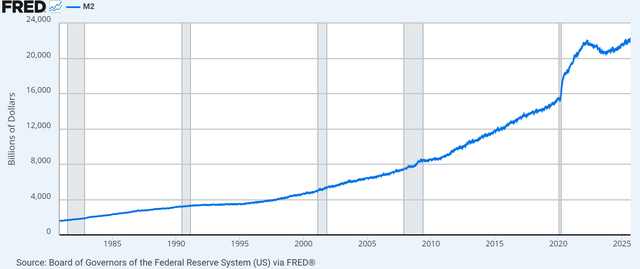
M2 has indeed expanded from about $15 trillion pre-pandemic to just over $22 trillion today.
That is an increase in money supply of about 47%.
In contrast, capital in money market funds went from about $3 trillion pre-pandemic to about $7.3 trillion.
That is an increase of 143%.
If our previous analysis is correct and the Fed continues cutting, these money market investments will no longer be atypically lucrative. As such, the volume of capital in them would likely drop back down to a normal amount.
If we assume the pre-pandemic percentage of M2 in money market funds, that would be about 20% of capital, or about $4.4 trillion.
This implies that the extra $2.9 trillion that is sitting in money market funds today would need to find a new home. Those who want to maintain the high yield they are currently enjoying would be forced in 1 of 2 directions:
- Further out the duration curve.
- Further out the risk curve.
To the extent capital moves from money markets into long duration Treasuries, it would pull long end yields down. A trillion dollars is enough capital to make a significant difference. For this reason, I believe Fed cuts will be reflected in the long end of the yield curve, just probably not in a full 1 to 1 parallel ratio.
The capital that instead chooses to move out on the risk curve could go into some combination of high yield corporate bonds, high dividend equities, and preferred stocks.
We believe all 3 categories will benefit, as the influx of perhaps a trillion dollars or more would be a boon to market prices. This is an event that has happened many times in the past. In the previous cycle, it was dubbed TINA, or There Is No Alternative. With fewer risk-free options to attain a high yield, the remaining high yield securities become more attractive.
3 macroeconomic factors to watch for:
- Significantly reduced short-term interest rates
- Moderately reduced long-term interest rates
- Capital flows into high yield securities.
Each of these points to certain equities and preferreds that stand to disproportionately benefit.
Gladstone Commercial (GOOD) savings on interest expense
Gladstone Commercial has significant borrowings on their credit facility that is pegged to SOFR.
GOOD 10-Q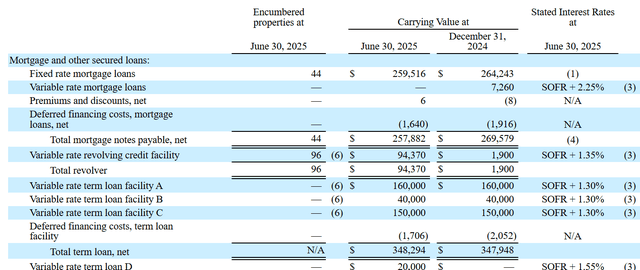
SOFR tracks with the Fed Funds rate, so as cuts come in, GOOD’s interest expense declines.
GOOD has $462 million of variable rate debt, so each 25 basis point cut, including the September cut, reduces run-rate of annual interest expense by $1.156 million.
That is about 2.5 cents of FFO per share accretion per 25 basis point Fed cut.
The market is anticipating 2 more cuts in 2025.
CME Group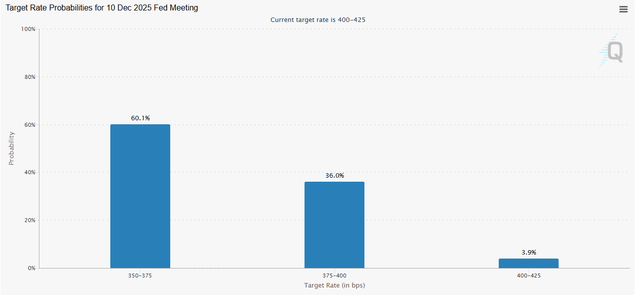
Based on our previous analysis, I agree with the market that October and December cuts are likely.
If there are indeed 3 cuts (including the September cut), that represents 7.5 cents of FFO and AFFO accretion for GOOD on a per share basis. That is significant savings that secures their outsized 9.5% dividend yield.
High debt will be less punished
REITs with high debt loads have suffered in the high interest rate environment. The higher the debt relative to equity, the more their interest expense took a bite out of earnings as interest rates rose.
Most REITs had well termed out debt, so the rise in interest expense was not immediate, but the high interest rate environment lasted many years such that most debt eventually had to roll to the now higher rates.
That is already starting to reverse as long-term interest rates have dropped significantly due to spread compression. To the extent that longer term rates come down in tandem with cuts, long-term rates could decline even further.
We have already observed many REITs able to issue 8+ year debt at 5% or less. That is a rate that allows for a healthy spread on investing the proceeds in properties.
Most capital-intensive businesses stand to benefit from cheaper financing, but it disproportionately benefits those with higher debt loads relative to total capital. It may be tempting to run a screen for high debt to EBITDA companies to find those with the most benefit. However, one has to be careful that the figure is not the result of simply having low EBITDA. Most of the companies that populate the top of this screen are up here for wonky reasons.
S&P Global Market Intelligence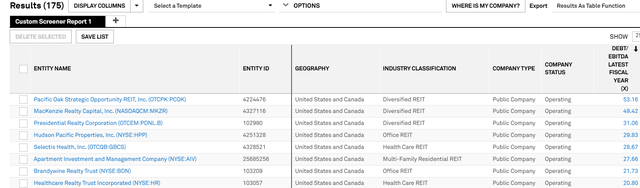
Apartment Investment and Management (AIV), for example, just has really high debt to EBITDA because a large portion of their portfolio is in development and thus not flowing with EBITDA.
Instead, what we are looking to pinpoint here are companies with ample EBITDA that simply operate toward the higher end of leverage. Specifically, we are looking for strong, growing companies with high debt loads.
NexPoint Residential (NXRT) fits the bill with a long history of organic growth in its Sunbelt apartments. They simply like to operate at high leverage with a debt-to-EBITDA of 9.39X.
A significant portion of NXRT’s debt is hedged to be functionally fixed rate, so they would not get the immediate interest expense savings like Gladstone Commercial, but over a few years, as debt rolls, NXRT is positioned to enjoy significant AFFO accretion from lower interest rates.
Capital flows into fixed income investments
The extra roughly $3 trillion currently sitting in money market funds above the normal amount may have to find a new home. As discussed earlier, some of it will flow to longer duration treasuries, but those looking to maintain a higher yield may seek out preferreds.
The REIT preferred market is relatively small, so it would not take all that much capital to really move market prices. Indeed, we observed in the previous cycle when the influx of capital sent most fixed rate preferreds with yields in excess of 6% to above par.
This cycle is different, as interest rates are unlikely to go as low as they were in 2021. As such, I think the threshold to be bid up to over par is closer to 7% yield.
At Portfolio Income Solutions, we track the live pricing of equity and mortgage REIT preferreds to monitor them for discount to par, current yield, and fundamental dividend security factors.
There are dozens of REIT preferreds with yields in excess of 8%, many of which will potentially be bid up to or above par. The key to maximizing returns in this potentially tailwind environment is to pay close attention to discount to par.
2 different preferreds may be trading at 8% current yields, but if one of those has an 8% coupon, it is already at $25 par and has minimal room to appreciate, as the threat of redemption prevents it from going much over $25.
However, if there is a 6% coupon preferred trading at an 8% current yield, it has a large upside. As interest rates decline, this preferred might be bid up to a 7% current yield, at which point it would still be discounted to par, so there would be no threat of redemption capping its upside.
There are over 10 opportunities of this nature presently, and as an example, we can look at Pebblebrook Preferred H (PEB) (PEB.PR.H).
Portfolio Income Solutions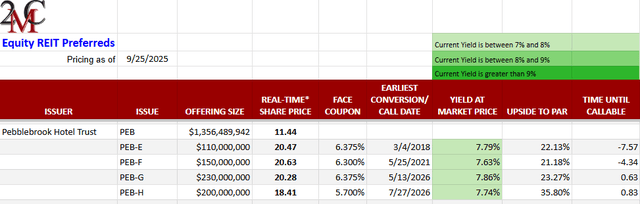
PEB is a highly respected and long-tenured hotel REIT, which is how they were able to issue preferreds at coupons in the low 6s and high 5s.
As environmental interest rates increased, these low coupon preferreds started to trade at very large discounts to par. PEB-H is trading at $18.41 against a par value of $25 because the market has decided a fair current yield in the current environment is 7.74%.
In an environment resembling the TINA of the past returns, where there is a scarcity of high quality high yield securities, we believe that equilibrant market yield will be closer to 6.5%. To get there, PEB-H would have to trade at $21.92.
That would be 19% capital appreciation on top of the 7.74% yield we are paid to wait.
Wrapping it up
As interest rates move, each security is impacted differently. Some benefit; others are harmed. The examples of opportunity presented in this article are just the tip of the iceberg. They can serve as a template of the concepts that signal disproportionate benefit.
Read the full article here

 Q4 2025 Earnings Call Transcript")
")
")
")
")
")
")
