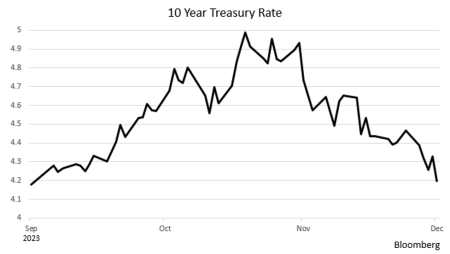
The headline CPI reading of no price inflation (0.0%) in October surprised the financial markets (but not us). It caused a bond market rally as yields (especially on the long end) fell. Then the PPI (Producer Price Index) showed up with a negative number for October (-0.5%), and this is generally a harbinger of what is to come in future CPI readings.
Economists agree that monetary policy acts with a long and variable lag – most think at least a year. If this is the case, then the recent rate hikes will continue to put downward pressure on economic activity well into 2024, at a time when that activity is already visibly slowing.
In our view, it is likely that we have exited this inflation cycle and may be headed for a bout of deflation unless the Fed acts soon to lower rates. The odds of that, at this time, appear miniscule, as Fed Board members have recently made clear in public pronouncements. At the present time, markets are pricing the first rate cut in the June 12-13 meeting next year. Our view is that it will more likely be the May 1-2 meeting set or perhaps earlier, depending on the incoming economic data.
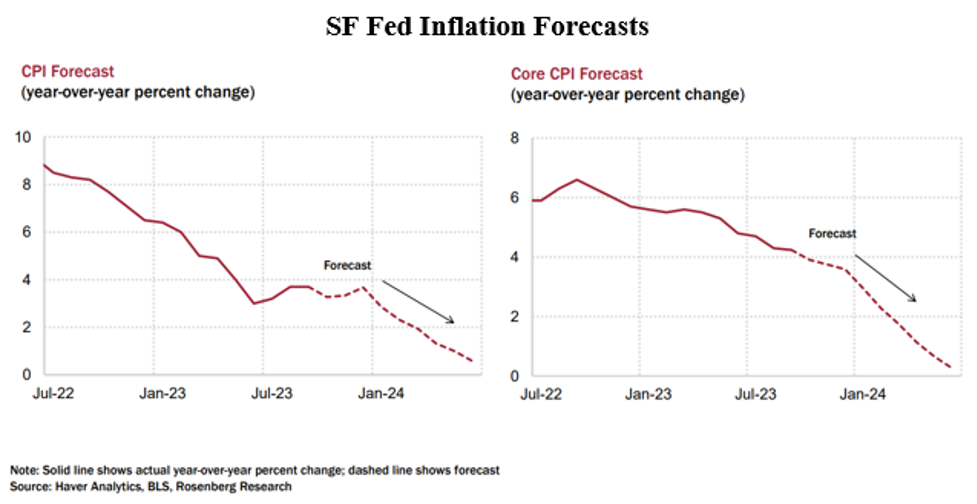
As we have discussed in several blogs, the data for the shelter component of the CPI (35% weight) is quite lagged. Without the shelter component (i.e., the other 65% of the index), the monthly change would have been -0.1% (i.e., mild deflation) and the year-over-year number, the one the Fed is fixated on, would be +1.5%, now below the Fed’s 2% holy grail. Substituting the Apartment List’s -1.5% year-over-year rent change for the shelter component would produce a backward-looking headline CPI of something closer to +0.5% on a year-over-year basis instead of the current 3.2% headline number. So, it isn’t any wonder why the Federal Reserve Bank of San Francisco economists think headline CPI inflation will approach 0% by the end of 2024 (see chart at the top of this blog).
The table shows the quarterly path of the headline CPI through the end of 2024 under the assumptions of 0.0%, +0.1%, +0.2%, and -0.1%. (We threw in the -0.1% assumption because we believe it is possible if the Fed actually keeps interest rates “higher for longer.”)
The Fed’s backward looing CPI target rate of 2% will be breached next March under the 0.0% inflation assumption. It will nearly be reached in June under the +0.1% assumption. We see the +0.2% assumption as the worst case, with inflation falling to 2.4% by December ’24. In addition, we believe that there is a significant chance that a low level of deflation could occur depending on the length and depth of the oncoming Recession. Thus, the -0.1% assumption column.
As noted above, and reinforcing our view that inflation is melting, the PPI (prices paid by businesses) fell -0.5% in October, more than reversing the +0.4% increase in September, revised from +0.5%. (We note here that recent revisions to most economic series have been downward.) The PPI for consumer prices, a sub-index of the general PPI, and a very good predictor of upcoming CPI releases, showed up in October as -0.6%, and a meager +1.4% on a year over year backward looking basis. While everyone is still focused on “inflation,” the recent data show a definite trend toward “deflation,” i.e., price declines.
Reinforcing Data
There is other data that reinforces this view.
- Retail Sales fell -0.1% in October, down significantly from September’s +0.9% growth. Once again, this coincides with a common thesis that the “excess savings” from the “free money” gifts from Uncle Sam have been exhausted. The decline was led by Automobiles (-1.0%), Furniture/Appliances (-0.9%; negative for four months in a row), and Building Materials (-0.3% from September, and -5.6% from a year earlier). The Johnson Redbook same store sales fell throughout October, making the August-September same store sales growth appear to be an anomaly (see chart).
- In addition, major retailers like Walmart
WMT
TGT
DG
- The result appears to be a dampening of expectations for the holiday shopping period. Challenger Gray and Christmas says seasonal hiring is the “lowest in a decade,” down 40% from that posted in 2021. And FedEx
FDX
- China’s economy continues to struggle, especially in their real estate sector. And while their reported numbers still show positive growth, it is much slower than “normal.” Key for the world is their exports which are down causing their export prices to fall (right side of chart below), thus exporting deflation to their trading partners. Likely, the falling export prices are due, at least in part, to slowing demand.
- The left side of the chart shows the N.Y. Fed’s Global Supply Chain Pressure Index, which, at a reading of -1.74 standard deviations, just hit a record low (data back to the mid-1990s). This index value comes as no surprise as global freight rates have tanked and Moller-Maersk, the world’s largest container shipper, is in the process of reducing employees by -10,000. So, it’s no surprise that the Cass Freight Index has tanked, now approaching its low point in the GFC Recession. We think this index will soon set a new low.
- Prices in the commodity markets continue on a downward path, including the price of oil, despite the hostilities in the middle-east and the continuing war in the Ukraine, and without an operating Nordstream pipeline from Russia to Europe. On September 26, the closing price of WTI Crude was $93.68/bbl. On Friday (November 17), it closed at $75.84, down -19%. It’s closing low on Wednesday (November 15) was $72.90, a peak to trough fall of >-22%. And we note that in China, the world’s largest oil importer, refineries have cut back production, a sure sign of a slowing economy there. Falling gasoline prices will go a long way toward reducing inflation expectations.
- Besides the overstatement of inflation by the headline CPI due to the rents issue, an examination of some key components of that CPI should convince the reader that the inflation pandemic is all but over. The following are price changes from September to October:
- Oil: -19% (September 26 to November 17)
- Energy: -2.5% (demand destruction)
- Airline fares: -0.9%
- Used cars: -0.8%
- Appliances: -1.2%
- Restaurants: -0.9%
- Hotels: -2.9%
- Moving/Freight: -3.1% (negative for three months in a row)
This last item is worth a comment: part of the negative price change in Moving/Freight in the month of October was likely due to slow home sales (no one moving) as people with low mortgage rates are “prisoners in their own homes!”
Employment
While many businesses continue to try to retain their employees after the labor shortages of the past couple of years, there is only so much cost cutting that can be done; eventually, if business is slowing, layoffs must occur. Earlier we noted that the world’s largest container shipper, Moller-Maersk, announced layoffs of -10,000. And none other than Citibank recently announced a -10% cut in its workforce. It seems like a couple of large layoffas have been announced each week in this Q4. Initial Jobless Claims have recently begun to rise (+231K week of November 11 vs. +218K week of November 4 and +211K the equivalent week in 2022). With the large layoffs recently announced, we expect Initial Jobless Claims to continue to rise.
Of equal or greater importance is the Continuing Claims data. In the latest week (November 11) these rose +32K, and are up +411K from a year earlier and +160K in Q4 alone. This is symptomatic that jobs are much harder to find than they were a year ago.
Housing
Housing is key to GDP growth. As discussed in prior blogs, there is a record number of new apartments under construction, and as they come online, supply increases. As a result, we are seeing both falling rents and rising vacancy rates. The chart, produced by Rosenberg Research, shows a combination of existing and new home sales. Note the huge falloff from 2020 and 2021, especially as interest rates were raised by the Fed beginning in early 2022.
Existing home sales are way down because of mortgage rates, and the major home builders are moving to downsize their offerings in order to have product at lower prices since housing affordability is at lows not seen since the 1980s. This is reinforced by the University of Michigan’s sentiment index of Buying Conditions for Houses. Note on the chart that historic lows have been breached. In fact, home buying plans fell hard in the November University of Michigan Survey, to a score of 33 from 44 in October, tied for the lowest recorded reading in the history of the Survey (back to the 1950s)! Again, since most homeowners have a mortgage rate in the 3% realm, even a sideways move is unaffordable with mortgage rates near 8%. As a result, housing appears to have entered its own Recession.
Manufacturing
Industrial Production (IP) fell -0.6% in October following a downwardly revised September (to +0.1% from +0.3%). The Manufacturing component was off -0.7% (vs. +0.2% in September, revised from +0.4%). Ex-auto (strike), Manufacturing was flat.
The Philly Fed’s Manufacturing Index was -5.9 in November, a bit better than October’s -9.0 reading, but now showing contraction for three months in a row. Almost all of the sub-indexes were lower, the workweek in particular (-11.4 November vs. -4.3 October).
The Kansas City Fed’s Manufacturing Index showed up as -2 in November vs. -8 for October. Every major sub-index in this report, too, was negative including employment, the workweek, production, backlogs, and capex. There is no doubt in our minds that Manufacturing is already in Recession.
Foreign Trade
Another sign of easing inflation shows up in the foreign trade data. In October, Import Prices fell -0.8% and are down -2.0% from a year earlier. Excluding oil imports, Import Prices still fell in October (-0.2% and -1.1% lower than they were in October ’22). Export Prices also fell (-1.1% in October alone and -4.9% vs. a year ago). In the developed world, as noted above, China is struggling, the U.K.’s economy is flat as a pancake, while Germany and Japan both appear to have entered Recessions.
Final Thoughts
Clearly, inflation is melting. The October CPI showed up with 0% inflation, and the PPI for October was negative. Eliminating the current upward bias in the shelter component of the CPI and substituting current rental data would produce a headline CPI under 1%.
Somehow, despite the Fed’s own economists’ forecast of rapidly falling inflation in 2024, the Fed appears to be hellbent on continuing to fight a war they have already won, and in doing so, risks precipitating a deep Recession. We think it is too late to avoid a Recession, the only remaining question is its depth and duration. An early movement of rates to less restrictive territory and rapidly to the 2.5% “neutral” zone would go a long way toward blunting the oncoming Recession’s ill effects. But we don’t think this Fed sees these realities.
After nearly two years of falling bond prices as the Fed raised rates at the fastest pace in history, it is now clear that they are done raising, as disinflation is now appearing and we even see the possibility of deflation. Because Recession is normally accompanied by flat/down corporate earnings, it now appears that the beaten-up bond market will shine in 2024.
(Joshua Barone and Eugene Hoover contributed to this blog.)
Read the full article here


