
")


")
Investment briefing
Shares of Belden (NYSE:NYSE:BDC) were punctured since my September publication, trading 27% lower at the time of writing. Two notable features called the reversal.
First, the technical patterns, as BDC tested former highs in October. It couldn’t retake the previous level. As traders lifted the bid to its July highs, it bounced away with high volume selling. Couldn’t find the buyers to continue the rally (happy to get out at former highs? No long-term buyers to tip the market higher?), hence the roll down (Figure 1). Bad news happens in downtrends, we must get used to it.
Second, the company revised its Q3 sales + earnings lower to the market in mid October. The market’s reaction was swift. Offers on BDC’s stock fell to $64.$65 from highs of $95–$100 (see: black circle Figure 1). It now trades at $69 per share, more than a month after the announcement.
Questions:
(1). Is this the bottom for BDC? Does the market believe it is worth ~$70/share, or, will we revert to the mean / price even lower?
(2). Was the revision really this much of a negative event?
(3). Where to from here?
This analysis will scope this out for investors. The critical investment facts are as follows:
- BDC’s earnings growth is commendable, in an uptrend and compounding at 12% the last 5 years
- Investors pay 10.6x forward earnings and 9.4x forward EBIT, and buying a 12.5% cash flow yield at the time of writing
- Mixed performance in Q3 earnings + Q4 / FY’23 projections
- BDC is producing 12-13% rate on capital deployed and thew off $8/share in FCF last TTM.
Net-net, there are multiple supportive factors that the recent selloff in BDC’s equity opens an intriguing window of allocation. The company displays sensible economics in creating value, is compounding return on its invested capital, and is FCF/share positive. I reiterate BDC a buy.
Figure 1.
Source: Tradingview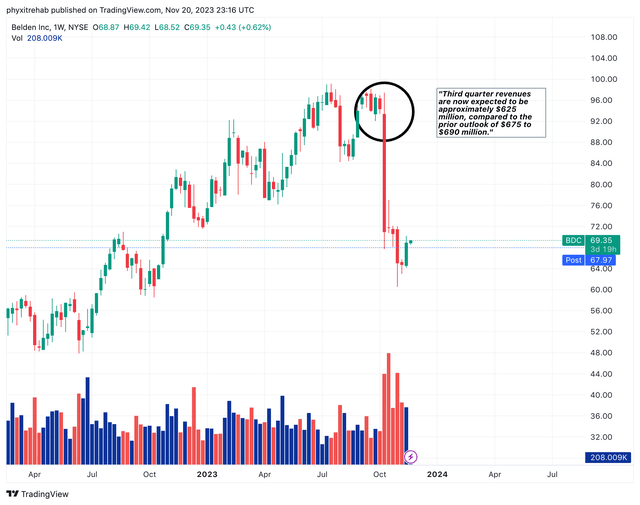
Critical investment facts to reiterated thesis
The company’s recent financial performance reveals a nuanced landscape influenced by market dynamics and strategic shifts.
1. Q3 Observations
For the quarter, BDC put up revenues of $627mm, beating consensus estimates. But its numbers were in line with management’s earlier revisions, and a 7% YoY decline.
The outcome is bifurcated here, and the theme was constant throughout the P&L— lower growth, higher margins. On one side, end-demand softness slowed growth. But the company’s pivot towards solution sales drove upsides at the margin. Gross margins loosened by 280bps to 39%, and EBITDA to sales decompressed 80bps to 18.4%.
As to the divisional takeouts, growth was underscored by contributions from both segments.
-
Industrial automation:
- The industrial automation business contracted by 4% YoY. In contrast, it produced growth at the EBITDA margin, up 230bps to 22.5%.
- Sequentially, industrial orders in Q3 were down 21%. This is due to (i) a temporary pause in end customer demand, and (ii) inventory management from OEMs and distributors to reduce their supply.
- The company anticipates a subdued demand in the upcoming quarters as end users adapt to the slowdown in growth.
-
Enterprise solutions segment:
- The enterprise solutions segment represented 45% of total sales in Q3.
- It faced a significant YoY contraction of 14% in revenues. EBITDA margins were down by 110bps YoY.
Despite turnover across segments, operating strengths ensured strong FCF conversion. The company has now produced $260mm in surplus cash flow on $2.6Bn in revenues in the TTM (9.9%), $30–$50mm above the last 1–2 quarters. This is cash that can be redeployed into additional growth areas.
The firm’s M&A investments of nearly $110mm and $150mm in share buybacks YTD exemplifies this. Particularly with the acquisition of CloudRail, an edge software provider catering to industrial environments. But the company has also reduced its float by 4% this year, repurchasing 1.7mm shares.
Figure 2.
Source: BDC Q3 Investor Presentation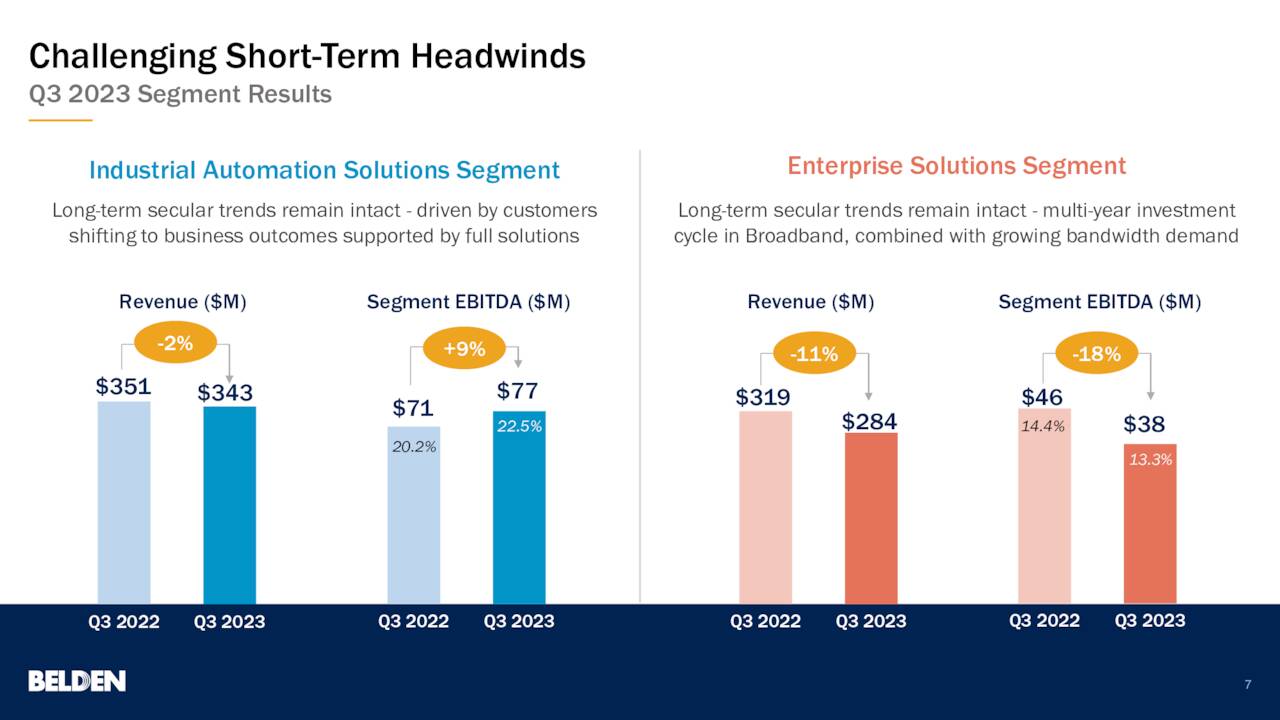
Economic value
BDC is compounding shareholder wealth and the market is recognizing this by lifting the bid on its share price. Remove the Q3 earnings blip from the picture, and stare at the raw economics. The company produced an additional $150mm in NOPAT on a $51mm smaller capital base from 2020–date. As it rotated capital more efficiently, BDC produced $2.6Bn in additional market value from 2020 to its highs in July 2023.
Critically, these stock returns are justified by the business returns. As shown in Figure 3, BDC is still compounding capital at 12–14% each rolling TTM period since 2022 with the rate of its earnings growth.
How the business returns relate to stock returns:
- This is a modest margin, high capital turnover business. No one factor dominates. Sales must be booked and exit the door at a reasonable pace—which they do, at 1x capital— and BDC recognizes a reasonable margin of 12–13% on these. To me this suggests it enjoys cost leadership and consumer advantages. Critically for BDC, each $1 of capital invested rotates to ~$1 of sales (and is increasing), bolstering the investment view next in the 1-3 years.
- The business returns in context explain the corporate value BDC is creating for shareholders. Long-term market average returns are c.12%, a moderate threshold to employ as a benchmark. In investment analysis, all corporate returns above this 12% watermark are considered economically valuable. For BDC, it has punched up above this level consistently since 2022 (Figure 4). It beat the return threshold of 12% on its investments at multiple points, and the market did the rest re market valuation.
Figure 3.
BIG Insights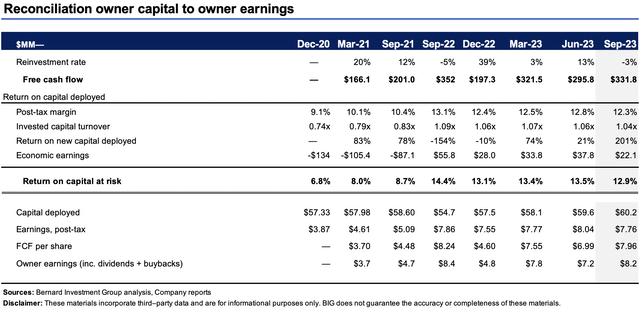
Figure 4.
BIG Insights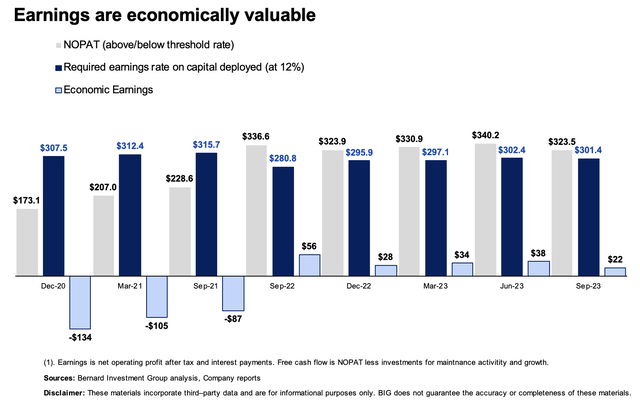
The business is producing economically valuable earnings and still throwing off plenty of cash to its shareholders. In this case the firm’s dividend is well supported. FCF per share has grown to $8.00/share in the TTM, its highs mark since 2022, after trending higher for 1 year. A 12-13% rate on capital with $8/share in FCF (11.5% of market value) spells a value proposition in my eyes. Going forward, this puts BDC in a good position to continue unlocking value for shareholders in my view.
Figure 5.
Disclaimer: These materials incorporate third–party data and are for informational purposes only. BIG does not guarantee the accuracy or completeness of these materials. (Sources: Bernard Investment Group analysis, Company reports)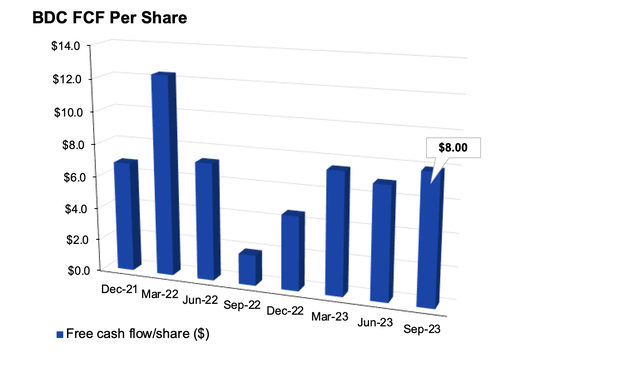
3. Forward Outlook
Two themes are critical to grasping the forward picture with this company.
- Post-earnings drift mild, suggesting optimism
- Critically, investors were immediate to reprice their consensus view on BDC following its earnings pre-announcement. This was done both swiftly and effectively. The post-earnings drift in BDC’s stock price has been modest and biased to the upside. This implies the market still expects a period of reasonable business for the company.
- If it does re-trace 50% of the selloff as a ‘mean reversion’, you are looking to the $79s (Figure 3). This is within a longer-term uptrend for the company.
- Sales and earnings guidance:
- For Q4 the company projects sales in the range of $510mm—$530mm on adj. earnings of $1.05—$1.20 per share.
- This calls for a FY’23 revenue decrease of 4%—5% and 4-5% growth in earnings.
One might argue the market over extended the price range for BDC in the reaction to its Q3 pre-announcement. It often does, providing opportunities. However, the companies underneath have provide opportunities as well.
Figure 3.
Source: Tradingview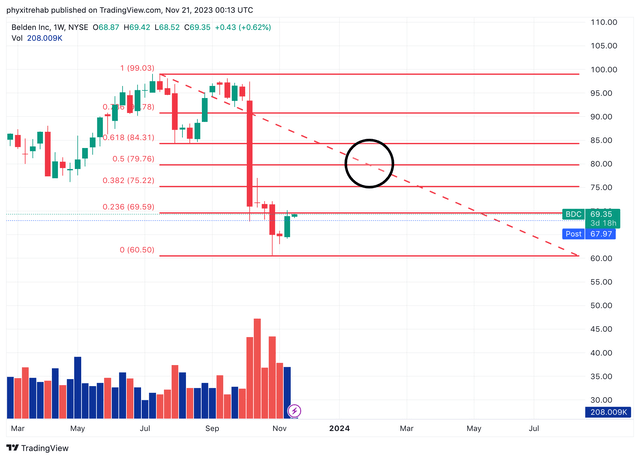
Valuation and conclusion
The stock sells at 10.6x forward earnings and 9.4x forward EBIT, and buying a 12.5% cash flow yield. These are 53% and 50% discounts to the median of IT companies respectively. Such compressed valuations warrant a thoughtful attention. Anything this heavily discounted either represents 1) a lowly valued company, or 2) a statistical discount.
We’ve demonstrated BDC is not a lowly valued company. It is investing reasonable sums of capital to maintain + grow its competitive position, clipping 12-13% return on these investments (1-2 points above the hurdle rate), whilst growing FCF per share for investors.
My judgement is that BDC at 9.4x EBIT is a statistical discount and offers investment value. This is supported by the notion that:
(1). Compounding BDC’s intrinsic value at the function of its ROIC and reinvestment rate, the market has been an accurate judge of fair value for the most part.
(2). The selloff is out of line with the last 3-years price data, even with poor news. Such a sharp exit provides an opportunity to buy below fair value in my opinion.
With these points in mind I look to a fair value of $3.6Bn or $86 per share, around 25% upside potential.
Figure 4.
BIG Insights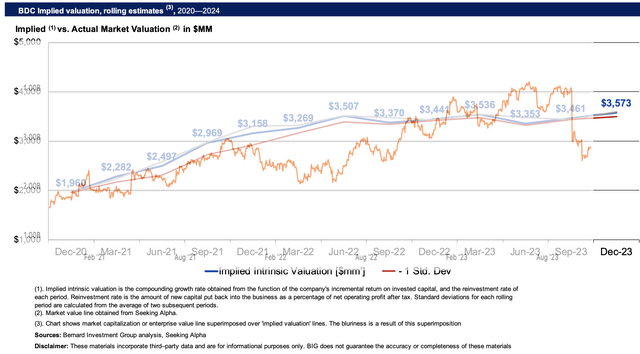
In short, only the market will tell us in time if BDC will push to these levels. But there are supporting factors that maintain a bullish posture.
One is the recent history of earnings growth, economic returns and FCF/share growth. These didn’t change with BDC’s revised view on sales, and are a bedrock of quality for the coming periods in my opinion.
Two, the reignited risk appetite investors have bought on following the Fed’s November FOMC meeting. This has spurred a period of new demand for risk assets in general.
Three, starting valuations are compelling and provide excellent scope for re-rating in the next 12 months. At 9.4x forward EBIT, my judgement is that BDC is statistically discounted, and that returns can be magnified at these valuations.
Net-net, after closely examining the investment facts, I reiterate BDC as a buy.
Read the full article here
")

 Q4 2025 Earnings Call Transcript")
")
")
")
")
")
