
")

")
")
Intro
Berkshire Hathaway (NYSE:BRK.A) (NYSE:BRK.B) is a sprawling conglomerate with operations in several industries. This business empire was built using Mr Buffett’s investment savvy and acquisitions funded with low-cost insurance float as well as free cash flows from operating subsidiaries.
The stable low-cost funding has enabled Berkshire to make large deals when others could and make profits better than the market. This formula has worked like magic for several decades, though the FED has thrown a spanner in the works starting from the great financial crisis of 2007-2008. The interest rates were kept low for a historically long period and the stable low-cost funding stopped being a competitive advantage in a market awash with liquidity. During the last 15 years, it has become increasingly difficult for Berkshire to find well-priced acquisitions.
It would appear that the period of ultra-low interest rates has finally ended, as the FED has been raising rates and the longer-term yields have settled at levels last seen only before the great financial crisis. In this environment, the stable low-cost funding of Berkshire becomes a competitive advantage once more. We expect Berkshire to do quite well in this environment.
The importance of the float
Berkshire Hathaway was built around the idea of taking cash flows from mature companies and redeploying them at a higher rate of return. Berkshire Hathaway, initially a textile mill acquired by Buffett, itself was a cash cow that helped fund his other acquisitions. The declining businesses also brought with them a whole host of operational issues that sometimes did not pan out as planned. Eventually, Buffett came up with the idea to fund his acquisitions using a more stable source of cash, – the insurance float. Berkshire acquired the first insurance company in 1967 and has not stopped since. The float kept on growing.
Berkshire Hathaway Annual Report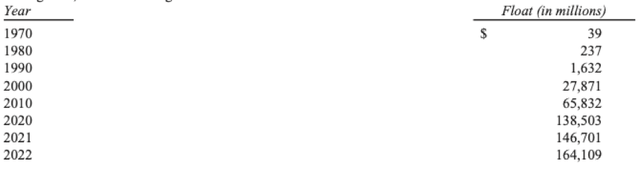
Let’s take a step back and define insurance float. Insurance companies collect premiums upfront to provide coverage for a set period. As premiums are paid out when losses occur other customers renew their policies, making the overall sum that insurance companies get to keep rather stable. We call this source of funds – the Float.
This cash is usually invested in safe assets to generate a rate of return and provide instant liquidity in case unusually large losses occur. As interest rates have decreased, insurers were forced to invest in ever lower-yielding assets, reducing the profits that float generates. With the rise in interest rates, insurers are now able to redeploy proceeds from maturing low-yielding bonds at much more attractive rates. Berkshire Hathaway is no exception.
Berkshire currently has a cash and cash equivalents hoard of circa $140 billion, and it will also benefit from the increasing yields just like the other insurance companies making its float significantly more profitable. The 5-year treasury yields, for example, are currently 4.7%, after hovering in the sub 2% range since 2011 and the short-term yield has appreciated even more. The interest income that Berkshire generates has increased to $1.4 billion in Q2, up from $0.2 billion in the prior year.
Investment options for float
More importantly, Berkshire is no ordinary insurance company. Unlike most large-scale insurance companies, Berkshire retains all of its profits and as a consequence has built up a huge equity base, which was also invested by Mr Buffett and compounded at attractive rates of return. Today Berkshire has an unrivalled equity position and several uncorrelated cash flows from multiple businesses which it can use to cover any insurance losses if needs be. Unlike any other insurance company, Berkshire is not forced by regulation to invest its float in secure investment-grade bonds and treasuries. It can also purchase equities or make outright acquisitions.
Buffett has been keeping a war chest of cash equivalents waiting for the right investment opportunities to come about. Such an approach has hurt Berkshire as the ultra-low interest rate environment continued for longer than anybody had expected and in a market awash with liquidity attractively priced acquisitions were few and far between. Berkshire was stuck with earning practically nothing on its float.
It is still quite early in the cycle but it is very likely that in the next few years, the investment climate will improve. Generating 4-5% on cash equivalents is great when considering that the same portfolio was paying 1% a couple of years ago. On the other hand, Berkshire got where it is today by making acquisitions and compounding at rates of return over 12%. Berkshire will benefit from the higher interest income straight away, but improvement of acquisition climate would be a considerably more positive development.
The value of Berkshire today
We can estimate the value of Berkshire by applying a valuation multiple to operating earnings, excluding investment income, and then adding the value of investments held on the balance sheet. We do not have to worry about conglomerate discounts or corporate costs as Buffett has been a good stalwart of capital.
|
Berkshire Hathaway |
FY2021 |
FY2022 |
Q2 2023 |
|
Insurance division |
|||
|
Interest, dividend and other investment income |
5,649 |
7,724 |
2,912 |
|
Dividend income |
5,060 |
6,039 |
1,522 |
|
Interest and other investment income |
589 |
1,685 |
1,390 |
|
Berkshire |
|||
|
Operating earnings before taxes |
32,291 |
34,699 |
11,444 |
|
Operating earnings excluding investment income |
26,642 |
26,975 |
8,532 |
|
Insurance underwriting |
728 |
-90 |
|
|
BNSF |
7,861 |
7,708 |
|
|
BHE |
3,293 |
3,146 |
|
|
Manufacturing |
9,841 |
11,177 |
|
|
Services and retailing |
4,711 |
5,042 |
|
|
Tax rate |
0.21 |
0.21 |
|
|
Earnings |
21,047 |
21,310 |
|
|
PE Multiple |
15 |
15 |
|
|
Value of operating businesses |
315,708 |
319,654 |
|
|
Value of investments |
545,188 |
||
|
Total cash and cash equivalents |
44,611 |
||
|
Short-term investments in U.S. Treasury Bills |
97,322 |
||
|
Investments in fixed-maturity securities |
22,353 |
||
|
Investments in equity securities |
353,409 |
||
|
Equity method investments |
27,493 |
||
|
Total Value |
864,842 |
||
|
Market Cap. |
755,000 |
||
|
Discount |
-12.7% |
Berkshire Hathaway financial statements
The value of investments on the balance sheet makes up 2/3 of the overall valuation of Berkshire. Even when we apply slightly different PE multiples on operating earnings valuation of Berkshire does not change that much. Berkshire is currently trading close to fair value and we can state this with quite a high level of certainty.
This year, due to higher interest income, the operating income of the business will grow by about $4 billion. If we apply a 15X earnings multiple to the operating earnings, we would estimate that the value of Berkshire will increase by $60 billion,. This sum is impressive on its own but would increase the overall value of Berkshire by less than 10%. Such a rate of growth is far from impressive.
Evolving sources of the float
As mentioned prior, Berkshire was set up to redeploy cash flows through acquisitions of public and private companies. Initially, free cash flows from mature companies were used, and then insurance float was the main source of funds. Over the years, with many great acquisitions, Buffett has built a formidable collection of strong, capital-light and growing businesses that generated a sustainably growing stream of free cash flows. Nowadays the cash flows from operating businesses are the biggest source of funding for acquisitions.
In FY 2022 Berkshire generated almost $35 billion of operating earnings (pre-tax). Some of this money is spent on growth projects within operating subsidiaries, while the rest is redeployed by Mr Buffett. This figure is significantly more than the additional funds generated by increasing insurance float. If the current float of $160 billion could grow at 5% per annum, the growth would deliver an additional $8 billion to be redeployed on top of operating earnings.
Berkshire has about $30 billion (after tax) coming in the door annually from operating earnings and increasing insurance float and it does not pay a dividend. Buffett and the team have quite the task of redeploying all of it. With high equity valuation multiples and intense competition from private equity, it was not easy to find good deals and Berkshire has been stashing funds in cash equivalents.
This might change soon. As interest rates rose, interest income increase was the first-order effect. The likely second-order effect of higher rates would be more attractive prices for companies in public and private markets.
Changing market valuations
Public markets:
The S&P market currently trades at a Schiller PE of 30X, which is significantly above the longer-term median of 16 which leads many analysts to assume that the market is overvalued. This reasoning is simply wrong. Public markets reflect only a relatively small slice of the American economy and that slice has been increasingly made up of tech companies. These companies are often high growth, capital-light, invest heavily upfront and sometimes even have defensible characteristics, – a lot of these businesses are worth the 30-40x PE ratios. So what the long-term Schiller ratio trends show is not only valuation but also the changing composition of the US market.
To get a better sense of the like-for-like changes in valuation it would be useful to look into old economy indices such as Dow Industrial. Dow had a couple of tech names added to it recently but is still mostly made up of traditional businesses. Old economy companies are capital-heavy therefore price-to-book value is a good proxy for value, we use it to track market valuation trends. The PB ratio of the Dow Industrial Average has declined considerably since March 2022. We conclude that public market valuations are improving.
Private markets:
Valuations in the private markets, quite naturally, are not that easy to follow and usually take more time to adjust, but we see the trend changing here as well. Increasing financing costs as well as economic uncertainty is making it more difficult to finance the deals thus cooling the market.
Over the past year, PE-related deal volumes have declined ~30% (Q1 2022 to Q1 2023), taking the market back to pre-COVID levels.
Private equity-led buyouts in the first half of 2023 totalled $202.47 billion globally, down 58% from the year-ago period.
The reduced buyer’s appetite should gradually translate into lower prices, which the sellers are willing to accept. It is still early in the cycle but the signs are definitely positive.
The expected value growth
Assuming that the markets will eventually become a lot more attractively priced in a higher interest rate environment, we expect Berkshire to become more acquisitive. We expect that future operating earnings as well as insurance float to be re-invested through acquisitions.
Assuming that of the $30 billion in operating free cash flows, $5 billion is spent on growth projects within operating subsidiaries. $25 billion would then be spent on acquisitions per annum. These acquisitions would deliver additional earnings to the group on top of the existing organic earnings growth of the operating subsidiaries.
Over the past 5 years, while operating in the ultra-low interest rate environment, Berkshire has grown operating earnings at a rate of about 11%. While the value of investments held on the balance sheet increased by a rate of 8% per annum on average. This was a combination of organic growth and acquisitions.
|
Operating earnings growth of BRK |
FY2017 |
FY2018 |
FY2019 |
FY2020 |
FY2021 |
FY2022 |
|
Total revenues |
239,933 |
247,837 |
254,616 |
245,579 |
276,203 |
302,089 |
|
Total costs and expenses |
221,237 |
219,214 |
225,703 |
231,289 |
243,945 |
266,629 |
|
Operating earnings |
18,696 |
28,623 |
28,913 |
14,290 |
32,258 |
35,460 |
|
Insurance underwriting |
(2,219) |
1,566 |
325 |
657 |
728 |
-90 |
|
Insurance–investment income |
3,887 |
4,554 |
5,530 |
5,039 |
4,807 |
6,484 |
|
Railroad |
3,959 |
5,219 |
5,481 |
5,161 |
5,990 |
5,946 |
|
Utilities and energy |
2,033 |
2,621 |
2,840 |
3,091 |
3,495 |
3,904 |
|
Manufacturing,service and retailing |
7,282 |
9,364 |
9,372 |
8,300 |
11,120 |
12,512 |
|
Operating earnings excluding insurance underwriting |
17,161 |
21,758 |
23,223 |
21,591 |
25,412 |
28,846 |
|
Value of investments |
325,000 |
318,000 |
0 |
0 |
525,000 |
485,000 |
|
Cash equivalents |
134000 |
129000 |
159000 |
149,000 |
||
|
Equities |
191000 |
189000 |
366000 |
336,000 |
Berkshire Hathaway financial statements
The combined value of Berkshire grew at a rate close to 10% over the last 10 years, and so did the share price of Berkshire. We expect this rate of growth to increase going forward on the back of higher rates of return on reinvested capital. Nobody could tell by how much with precision, as we still have to see how the market valuations will develop.
A potential of say 12-13% returns might not be impressive to most investors, though consistency is the key here. At a 12% annual growth rate, BRK stock would triple in 10 years.
Risks
- The inflationary pressures might be short-lived and the economy can return to a low inflation and low interest rate environment.
- The health of Mr. Buffett can create extra volatility in the stock price.
- The next generation of acquisition deal makers in Weschler and Combs might not be as savvy as Mr Buffett.
- Major unexpected losses in the reinsurance and insurance divisions.
Conclusions
We believe that Berkshire Hathaway currently trades at fair value but we expect that value to grow at an attractive rate going forward. In the higher interest rate environment Berkshire will find more ways to redeploy capital at attractive rates of return and therefore will grow faster. We would be willing to add the stock to our portfolio even at this price. No fast money will be made in this stock, but patient long-term holders will be rewarded.
Read the full article here
")
")
")
")
")

 Q4 2025 Earnings Call Transcript")
")
")
