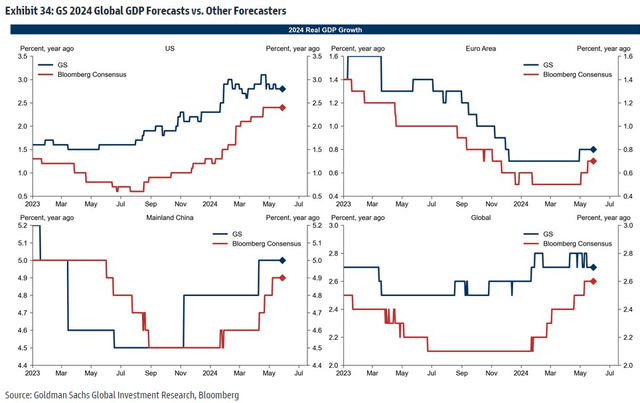
Global growth estimates for 2024 continue to be ratcheted up. Is it going to be a ‘soft landing,’ ‘hard landing,’ or even ‘no landing?’ Does it even matter at this point? The new volatility catalyst appears to be election risk. We’ve seen equity markets move in Mexico, India, and now France with the US general election less than 5 months away.
It has been interesting to see price action play out in stocks related to the Inflation Reduction Act (IRA) and CHIPS Act as Donald Trump has climbed in the polls and prediction markets. While it may be unlikely that a massive scaling back of these stimulative measures will take place, it’s a risk that should not be totally dismissed. And we might be seeing that fear show itself in price action in the Global X U.S. Infrastructure Development ETF (BATS:PAVE).
I am downgrading the fund from a buy to a hold. I had been bullish on the Industrials-heavy ETF for many quarters, but its valuation and momentum have me mildly concerned heading into the summer.
Global GDP Growth Estimates Inching Higher
Goldman Sachs
According to the issuer, PAVE seeks to invest in companies that stand to benefit from a potential increase in infrastructure activity in the United States, including those involved in the production of raw materials, heavy equipment, engineering, and construction. The fund invests in growth and value stocks of companies across diversified market capitalization.
PAVE has been a popular play since I last reviewed the fund in Q4 2023. Assets under management has swelled from $5.3 billion last November to nearly $7.5 billion today. The ETF sports a moderate 0.47% annual expense ratio while its trailing 12-month dividend yield is paltry at just 0.63%, about 0.8 percentage points under that of the S&P 500.
Share-price momentum has been strong, though, but I will highlight my concerns about its chart and technical situation later in this analysis. PAVE is middle of the pack when it comes to risk but its liquidity metrics are very healthy – average daily volume is slightly under one million shares while the ETF’s 30-day median bid/ask spread is low at just three basis points, per Global X.
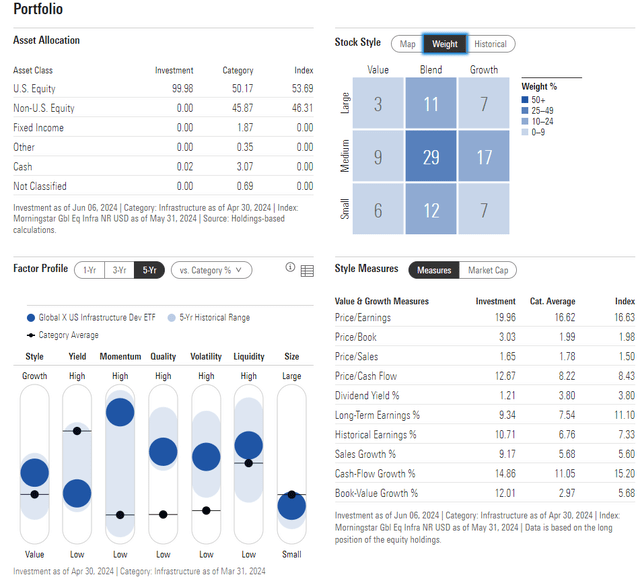
Zooming in on PAVE’s portfolio, the 5-star, Bronze-rated ETF by Morningstar has ample diversification across the style box. The plurality of the allocation, 29%, is considered mid-cap blend and there’s a slight bent to the growth style over value. It’s about an even split between small and large caps too. A key reason for my downgrade today is that PAVE is a full five turns more expensive compared to where it traded in late 2023. The price-to-earnings ratio is close to 20 while long-term EPS growth is seen under 10%, resulting in a lukewarm PEG of about two.
PAVE: Portfolio & Factor Profiles
Morningstar
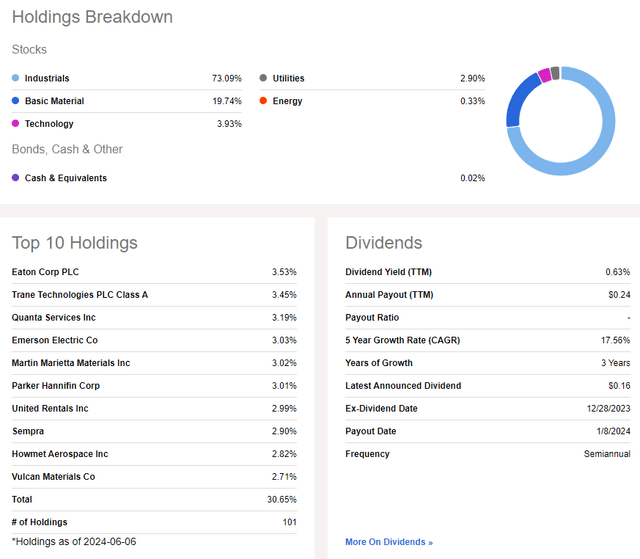
Given the relative weakness in markets since mid-April among cyclical sectors, PAVE has endured significant relative weakness lately. Industrials, 73% of the ETF, is now at its lowest relative strength level compared to the S&P 500 since the middle of 2022.
Hot AI and power-producing stocks have taken a breather, which has hurt PAVE. A significant overweight to the Materials sector worked early in the year, but it too has performed softly amid a fall in resources like copper in the past month.
PAVE: High Cyclical-Sector Exposure
Seeking Alpha
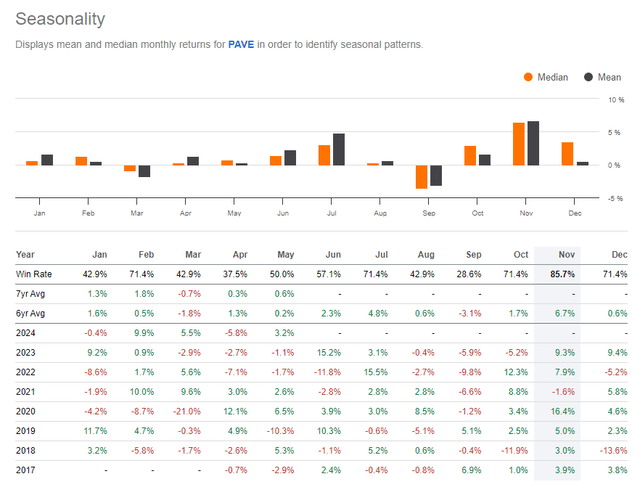
But seasonally, PAVE has tended to perform well through the middle of the third quarter. That bodes well for near-term price action and is an upside risk to my hold recommendation right now.
PAVE: Bullish Seasonal Trends Through Early August
Seeking Alpha
The Technical Take
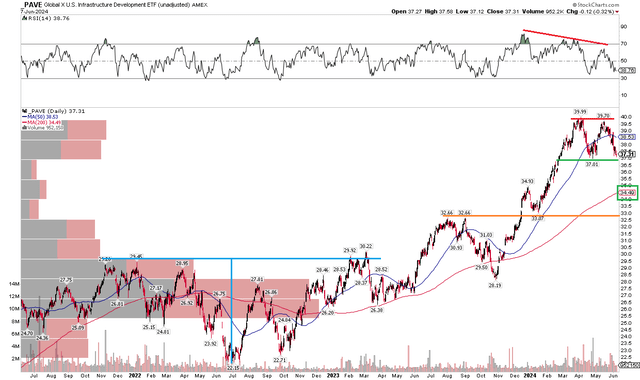
To be clear, PAVE has been a very strong performer since the market lows in the fourth quarter of 2023. Notice in the chart below that the ETF rose from $28 to nearly $40 at its peak in early April this year. But the rally came on weaker RSI momentum, a sign of bearish divergence to price. Now, the fund tests important support at the $37 mark.
If that level breaks, then a bearish downside measured move price objective to about $34 would be in play based on the $3 height of the current pattern. That downside mark would take PAVE under its rising long-term 200-day moving average and put it slightly below its early 2024 high of $34.93. I do think that would be a favorable place to buy the ETF based on risk/reward.
Bigger picture, PAVE more than achieved its upside target from the $22 to $30 range in 2022 through mid-2023. That $8 zone, added onto the $30 breakout point, yielded a target of $38, a level I detailed in my previous research note. So, taking profits here is warranted in my eyes.
PAVE: Bearish RSI Momentum Trends, $37 Key Support
Stockcharts.com
The Bottom Line
I have a hold rating on PAVE. There are some emerging cracks in the cyclical, risk-on trade even as global GDP estimates tick up. Political risks may be on the rise while AI-related Industrial stocks have turned more expensive.
Read the full article here


