Recently, I have been writing a lot about stretched valuations in U.S. equity markets and how investors can protect their portfolios against possible drawdowns. For example, based on consensus estimates, the S&P 500 Index’s 21x Fwd P/E is amongst the highest in its history except for the dot-com bubble and early 2021 (Figure 1).
Figure 1 – U.S. equity valuations are stretched (yardeni.com)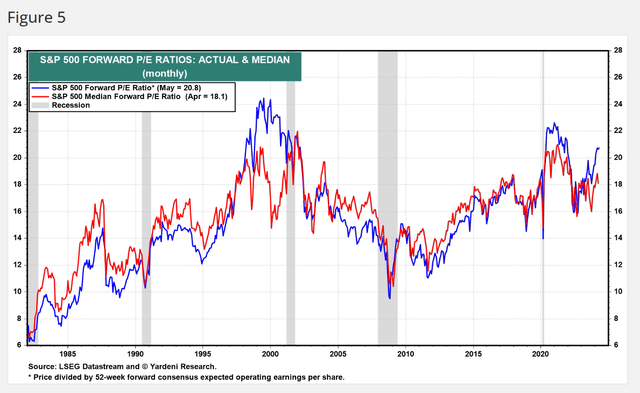
These strategies include something as simple as taking profits on big winners to reallocating funds to hedged products like the JPMorgan Hedged Equity Laddered Overlay ETF (HELO) or the First Trust Long/Short Equity ETF (FTLS) that can reduce portfolio downside.
Alternatively, investors can look for markets or niches where valuations are not as stretched. According to a periodic analysis by the institutional manager GMO, while U.S. equities are expected to have negative 7-year forward returns due to high valuations, other markets like Emerging Markets remain attractive for investors with a long investment horizon (Figure 2).
Figure 2 – Emerging markets are still attractively valued (GMO)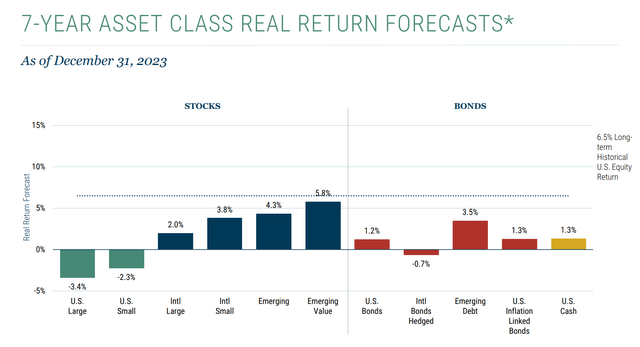
However, with over 100 dedicated Emerging Market ETFs listed in the marketplace, which Emerging Market Funds should investors consider? I believe the SPDR Portfolio Emerging Markets ETF (NYSEARCA:SPEM) is a fund that compares well against its peers.
The SPEM ETF charges one of the lowest management fees while consistently delivering 2nd quartile or better performance. Despite having a large allocation to underperforming Chinese equities, the SPEM ETF nearly kept pace with an ETF that excludes Chinese equities.
For investors looking to diversify globally, I recommend they take a look at SPEM.
Fund Overview
The SPDR Portfolio Emerging Markets ETF is a low-cost index fund that tracks the S&P Emerging BMI Index (“Index”). With over 6,000 constituents, the index is a float-adjusted, market cap-weighted index designed to capture the investable universe of publicly traded companies domiciled in emerging markets.
However, the SPEM ETF does not seek to fully replicate its underlying index. Instead, SPEM employs a sampling strategy that purchases a subset of the securities in the index to create a portfolio with generally the same risk and return characteristics of the index.
SPEM vs. Other Emerging Market ETFs
Comparing the SPEM ETF to its largest peers, the Vanguard FTSE Emerging Markets ETF (VWO), the iShares Core MSCI Emerging Markets ETF (IEMG), the iShares MSCI Emerging Markets ETF (EEM), and the iShares MSCI Emerging Markets ex China ETF (EMXC), we can see that the SPEM is a relative minnow with only $9 billion in assets (Figure 3). However, its costs are the lowest amongst the peer group, at just 0.07%.
Figure 3 – SPEM vs. peers, fund structure (Seeking Alpha)
The SPEM ETF is large enough such that most investors will not be liquidity-constrained, with a bid/ask spread of 0.03% (Figure 4).
Figure 4 – SPEM has a tight bid/ask spread (ssga.com)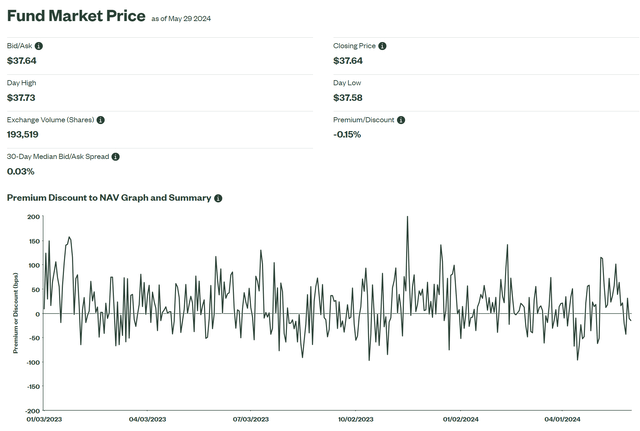
At the same time, the SPEM fund is nimble enough to buy $100 million market cap companies without impacting the securities’ price, as per its mandate.
Portfolio Overview
As mentioned above, the SPEM ETF does not fully replicate its underlying index. Instead, it owns a basket of 3,400+ stocks that is expected to have similar characteristics to the index. As of May 29th, 2024, the SPEM ETF’s portfolio has a 3-5 year EPS growth rate of 17.5% and Fwd P/E ratio of 13.0x compared to 17.5% EPS growth rate and 13.2x Fwd P/E for the Index (Figure 5).
Figure 5 – SPEM characteristics vs. index (ssga.com)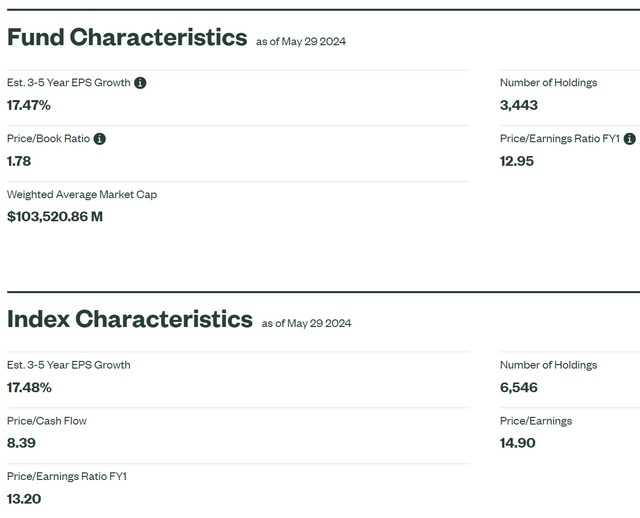
Geographically, the SPEM ETF’s largest allocations are China at 28.0%, India at 22.5%, Taiwan at 20.5%, Brazil at 4.9%, and Saudi Arabia at 4.9% (Figure 6).
Figure 6 – SPEM geographical allocations (ssga.com)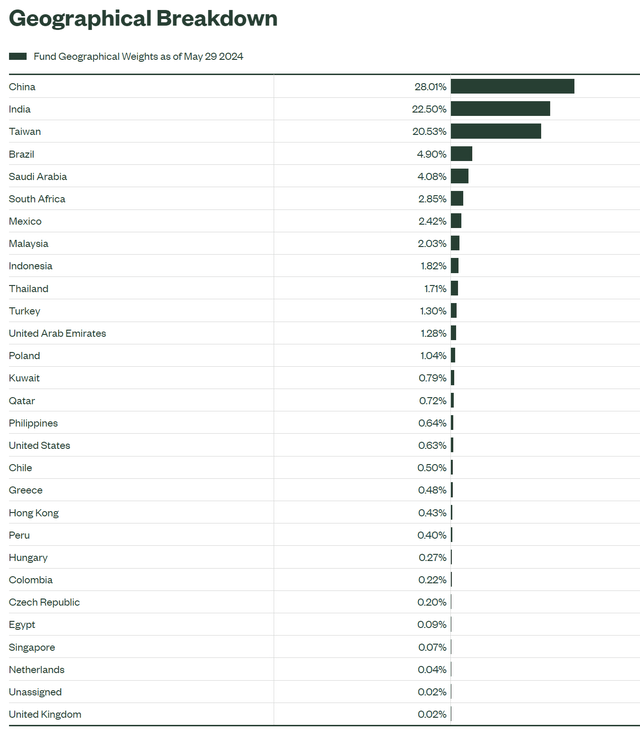
The SPEM ETF is broadly diversified in terms of sector allocation, with 21.5% weight in Financials, 19.2% weight in Information Technology, 12.8% weight in Consumer Discretionary, 8.8% weight in Industrials, and 8.2% weight in Materials (Figure 7).
Figure 7 – SPEM sector allocations (ssga.com)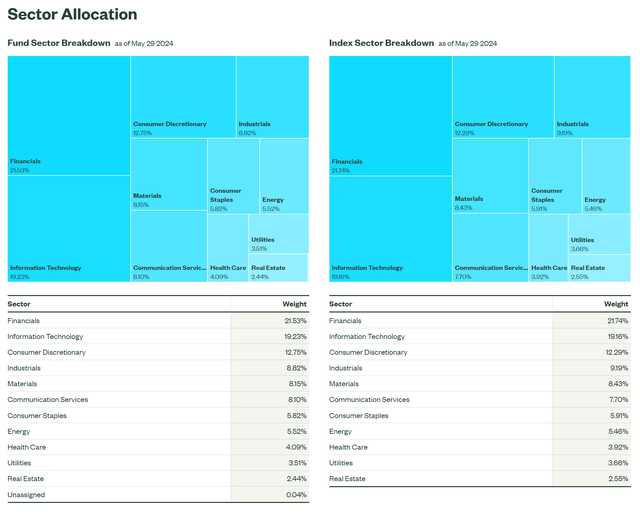
Historical Returns
Historically, the SPEM ETF has only delivered modest returns, with 3/5/10/15-year average annual returns of -3.4%/3.1%/3.9%/6.0% respectively to April 30, 2024 (Figure 8).
Figure 8 – SPEM historical returns (morningstar.com)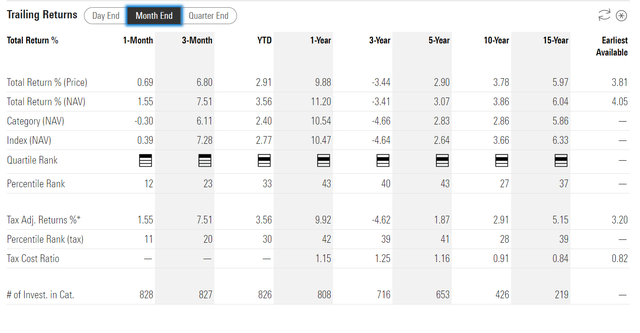
However, the issue is mostly due to the relative underperformance of the Emerging Markets asset class in the past few years due to China’s stock weakness, as the SPEM ETF is consistently 2nd quartile compared to its Morningstar Diversified Emerging Market peers.
In fact, when compared to the large AUM peers I mentioned earlier, the SPEM ETF has performed well, with 1-year total returns of 15.9% compared to 14.7% for VWO, 14.1% for IEMG, 12.7% for EEM, and 14.9% for EMXC (Figure 9)
Figure 9 – SPEM vs. peers, 1-year returns (Seeking Alpha)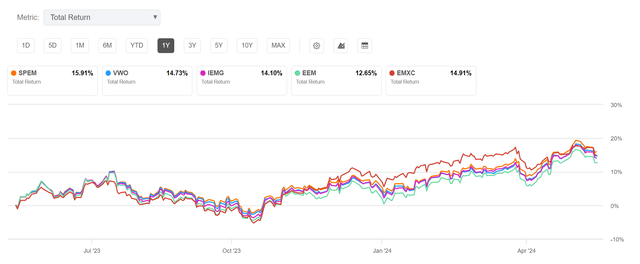
The SPEM remains the 2nd best-performing on a 3- and 5-year basis, with 5-year returns of 27.5% compared to 25.7% for VWO, 25.4% for IEMG, 17.5% for EEM, and 36.0% for EMXC (Figure 10).
Figure 10 – SPEM vs. peers, 5-year returns (Seeking Alpha)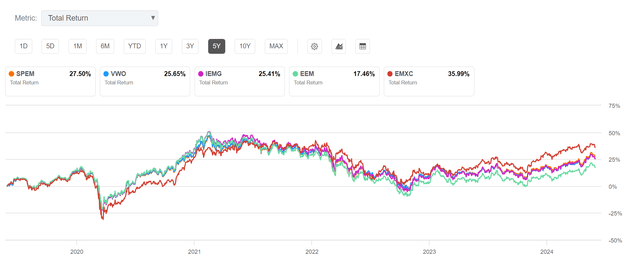
On a 10-year basis, the SPEM has been the best-performing, with 10-year average annual returns of 41.6% vs. 33.9% for VWO, 32.2% for IEMG, 20.9% for EEM, and 31.2% for EMXC (Figure 11).
Figure 11 – SPEM vs peers, 10-year returns (Seeking Alpha)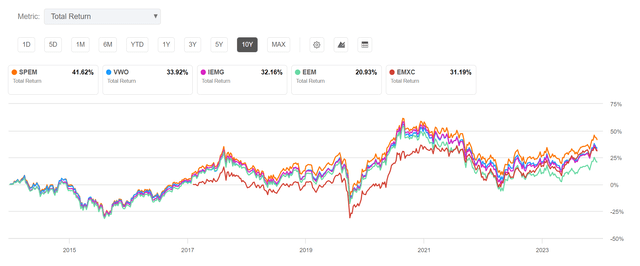
With Or Without China?
Sharp-eyed readers will note that the best-performing Emerging Markets ETF in the short term mentioned above is the EMXC. The iShares MSCI Emerging Markets ex China ETF, as its name implies, is designed to provide exposure to Emerging Markets excluding stocks from China.
China has been a hot topic in geopolitical circles, as the Chinese government is a direct competitor to the United States, and many leading Chinese companies like Huawei and ZTE have been the subject of sanctions by the U.S. and European governments.
Coupled with the fact that Chinese stocks, as modeled by the Shanghai Composite Index, have done nothing for the past few years, it is not a surprise that an index fund excluding Chinese equities would outperform (Figure 12).
Figure 12 – Shanghai Composite Index performance (stockcharts.com)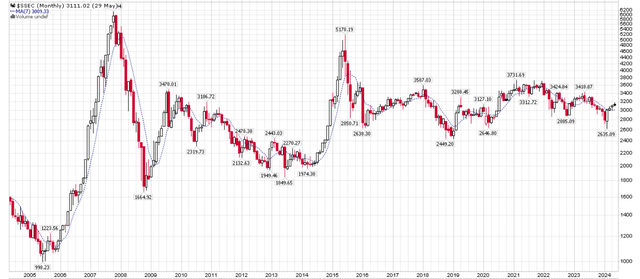
The important question is whether it is wise to exclude Chinese equities from one’s investable universe on a go-forward basis. For those who fear escalating geopolitical tensions between the U.S. and China, they should choose the EMXC for their Emerging Market exposure.
However, for me, I believe the valuations available in the Chinese markets may be worth the risk. For example, the MSCI China Index currently has a Fwd P/E of only 9.7x vs. 12.2x for MSCI Emerging Markets and 17.1x for MSCI ACWI (i.e. the world) (Figure 13).
Figure 13 – Chinese equities are cheap (msci.com)
While geopolitical risks are high, so are the potential rewards.
Furthermore, it is important to note that the SPEM ETF was able to keep pace with the EMXC ETF on a 1-year basis despite lackluster performance in Chinese equities, which account for ~28% of SPEM’s portfolio. This is like a boxer fighting with one hand tied behind his back.
I believe SPEM’s relatively strong performance is because the fund’s mandate of investing in companies above $100 million market cap allows it to buy many micro-caps that other emerging market funds cannot buy with their large- and mid-cap focused mandates. These micro-caps may have better growth prospects and are under-followed, allowing investors to outperform.
Risks For SPEM
The biggest risk to the SPEM ETF is the global economy. While the U.S. economy is still strong, many economists expect the global economy to weaken in 2024. If the global economy weakens, Emerging Markets will not be immune.
Another risk is the geopolitical tensions between the U.S. and China. Both leading American presidential candidates appear to have a hawkish stance towards China, and whoever wins the presidency in November will likely raise new tariffs and trade restrictions. This could negatively impact the Chinese holdings in the SPEM ETF.
Conclusion
With U.S. equity valuations trading near multi-year highs, I believe investors should consider diversifying into other markets. Emerging Markets, with their cheap valuations, appear to be a good place to allocate long-term capital.
The SPDR Portfolio Emerging Markets ETF is a low-cost Emerging Markets ETF that compares well against its peers. Its mandate and fund size allow it to buy smaller-cap equities that may have higher growth potential. I rate the SPEM ETF a buy.
Read the full article here


