

 Q4 2025 Earnings Call Transcript")


Thesis
We run a marketplace service. As a result, we have first-hand experience of how confusing the current time can be from our Q&A exchanges with our members. With so many macroeconomic uncertainties (inflation, interest rates, elevated equity valuation, et al.), it indeed feels bewildering.
At confusing times, first principles are especially important. Thus, it is the goal of this article to examine our investment strategies from timeless principles. I will use the SPDR® S&P 500 ETF Trust (NYSEARCA:SPY) to anchor the discussion. However, the same conclusion applies to other similar/equivalent overall market funds.
You will see why it is very clear to us why this is the time to trim SPY exposure once we look at the issue from a few timeless basic principles. To make the discussion more action-oriented, the remainder of this article is structured around these two questions that we’ve received from our readers and members:
- Why is now a good time to take some of the gains from our SPY exposure?
- And exactly how much gain should you take? Should we determine this based on the traditional wisdom of a 60% equity and 40% bond allocation?
SPY: Basic information
The fund probably needs no introduction. It is the most popular fund that tracks the S&P 500 Index (SP500), boasting an AUM (assets under management) of over $400B. It is also one of the most liquid exchange-traded funds (“ETFs”), with an average daily trading volume of over 75 million shares, many times more than its close peers like VOO, IVV, and VTI (see the next chart below). Because of its size and large trading volume, it has a very tight trading spread and ample liquidity. So that investors can buy and sell a large number of shares with minimal friction cost.
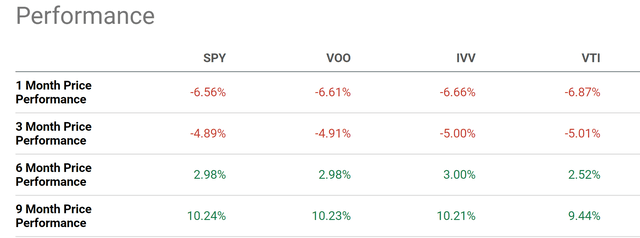
However, note that SPY also has a higher expense ratio (0.09%) than other large overall market funds. For example, both the iShares Core S&P 500 ETF (IVV) and Vanguard S&P 500 ETF (VOO) charge an expense ratio of only 0.03%, only 1/3 of SPY’s. Although the difference is quite small in absolute terms (only 0.06%). Hence, their performance closely tracks each other (see the 2nd chart below), and thus the analyses below on SPY can apply to these other similar/equivalent funds as well.
Seeking Alpha Seeking Alpha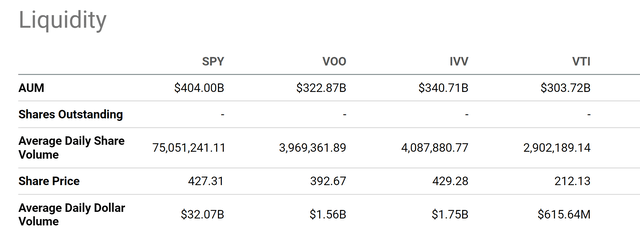
A good time to take some profit
The basic principle involved here is that all asset valuation should be benchmarked against risk-free rates. We can all agree that the stock market is currently overvalued in absolute terms. Its current Shiller CAPE P/E of around 29x has only happened a few times since 1880 (see the next chart below). However, this chart does not fully illustrate the risk premium in my view. To properly interpret the valuation premium, we need to benchmark it against risk-free rates.
multpl.com/shiller-pe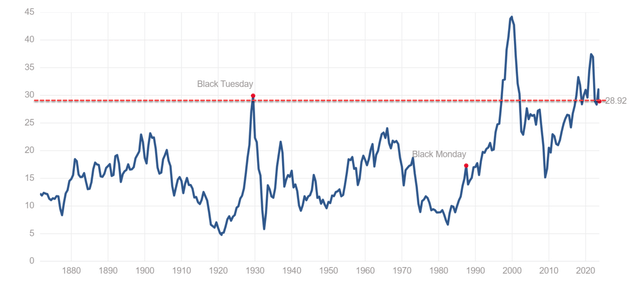
One way for such benchmarking involves the so-called ECY (S&P 500 Excess CAPE Yield) as shown in the chart below. The ECY metric measures the earnings yield of the S&P 500 on a CAPE basis (cyclically adjusted P/E) minus the 10-year Treasury bond yield (the blue line shown in the chart). Note that the chart is based on interest rates in July 2023, and the ECY was 2.13%. Considering that 10-year treasure rates were about 4% in July 2023, and it is currently around 4.75% as of this writing, my estimate of the current ECY is around 1.38% as shown by the green line. As seen, it is at the same level it was amid the dot.com bubble.
MacroMicro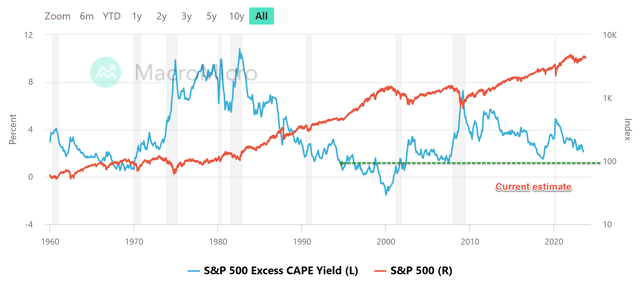
How much to sell and what to do with the proceeds
If you are convinced of the risk premiums as I am seeing above, then the next two logical questions are how much SPY you should sell and where to put the proceeds.
Let me answer the first question first. Most of us are familiar with the 60%-40% model and, therefore, some readers have asked if their SPY exposure should be trimmed according to this model. Our short answer is no. I believe fixed allocation strategies like 60-40 do not make sense in the current market conditions with high bond rates and high SPY valuation. In general, these fixed allocation strategies tend to miss extreme market opportunities as shown in the next chart below.
This chart shows the yield spread between the SPY and 10-year treasury rates, which provides the basis for our dynamic allocation strategy. It is programmed as a Google sheet, and you are welcome to download it via this link: Market Sector Dashboard. The idea is quite simple and has been very effective (probably because it is so simple) in our experiences. A larger yield spread indicates that stocks are cheaper compared to risk-free interest rates, and vice versa. As the yields spread, we adjust our bond-equity ratio dynamically. The specifics are detailed in our blog article.
The gist is that, say our baseline is 60-40 when the yield spread is around its average (about 0.35% as shown), we would then increase our equity exposure to be more than 60% when the yield spread is substantially above this average and vice versa. The situation during the COVID-19 panic sale is a good example. It made no sense to us when treasury bond rates are below ~1% and still allocate 40% to bonds. As you can see, the yield spread between SPY and 10-year rates has sharply declined this year to the lowest point since at least 2010.
Author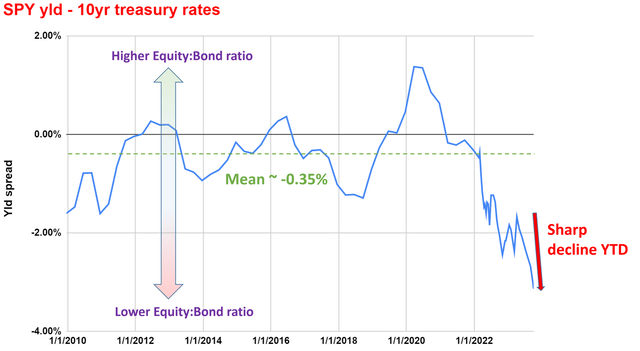
Now let me answer the 2nd question. The answer is rather simple if you buy into the idea of benchmarking SPY return by risk-free rates as I did in the chart below. My projection for SPY’s long-term return is about 6% under current conditions, consisting of about 4% earning yield (at a P/E of around 25x) and about 2% growth (assuming a 10% reinvestment rate and 20% return on capital employed). Well, guess what? Short-term treasury rates (12 months or shorter) are currently pushing towards 5.5% already. And investment grade corporate bonds are typically yielding about 6% already. As such, in case you do not feel comfortable with dynamically increasing your bond exposure as described above, parking the proceeds in the form of cash or cash equivalent (i.e., short-term treasury bonds or high-quality corporate bonds) is a totally sound strategy too.
Author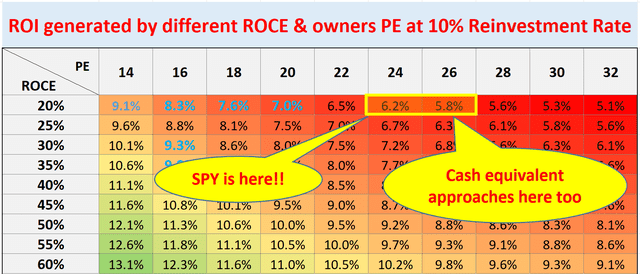
Risks and final words
Finally, it is important to point out the risks in our approach described above. More elaborate discussions of these risks are provided in this early article. Given the importance, it is worth reiterating:
The dynamic allocation method relies on the dividend yield spread. However, dividend yields do not always reflect business fundamentals accurately due to distortion by things irrelevant to business fundamentals, such as tax law and political climate. As a result, we do NOT actually use the simple difference as described above. We have to correct (and you should too) the distortions first. But the simple difference provides a good approximation already and illustrates the essence of our dynamic allocation idea.
To summarize, the goal of this article is to explain: A) why now is a good time to take some profit from SPY; and B) our thoughts on the allocation of the proceeds. For A, the key reason is that the risk premium of SPY is so out-of-whack relative to risk-free rates. As a result, we see SPY’s current valuation unlikely to be sustainable. For B, we don’t recommend a fixed allocation model. We prefer a dynamic model to allocate the proceeds. Alternatively, cash or cash equivalent is a sound strategy too, given that their yields are approaching our expected return potential from SPY.
Read the full article here

 Q4 2025 Earnings Call Transcript")
")
")
")
")
")
")
