If the “rally” in the S&P 500 seems confusing, it shouldn’t be. The rally is nothing more than a handful of names continuing to push the overall concentrated index higher. At this point, most of the gains are driven by the volatility dispersion trade, as traders play Ring Around the Rosie with the Magnificent 7 names.
It may seem completely random to see Amazon (AMZN) suddenly break out of trading starting on June 20 after struggling for months, coming on surging call volume and rising implied volatility. “It must be the AI trade; that is the only explanation! Of course”. However, notice in the chart below how the gains seemed to stop once the call volume subsided and implied volatility leveled off.
Bloomberg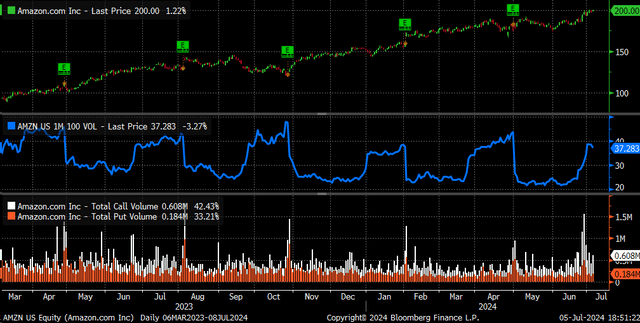
It wasn’t only Amazon that was in on the action; Microsoft (MSFT) was too. With the stock price surging, driven by a big move higher in implied volatility and stronger option volumes
Bloomberg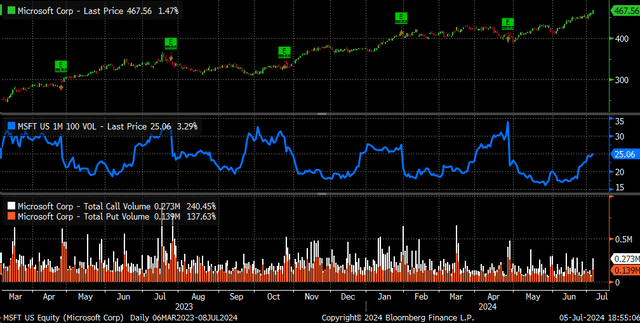
Alphabet (GOOGL) (GOOG) played along the week of June 20 with similar characteristics — surging call volume activity, an up movement in the stock, and rising implied volatility levels.
Bloomberg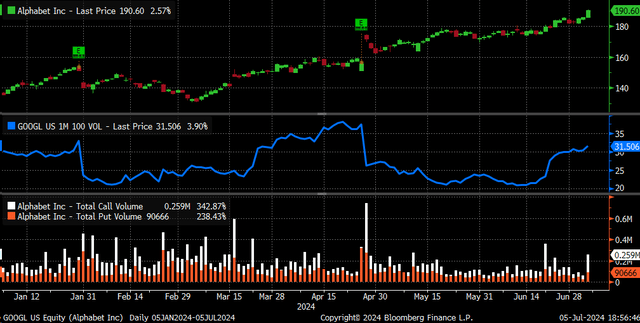
The funny thing is that when Amazon, Microsoft, and Alphabet stopped, Tesla (TSLA) picked it up on June 26. With a surging stock price, sharply rising implied volatility levels for an at-the-money 30-day option, and call volume surging.
Bloomberg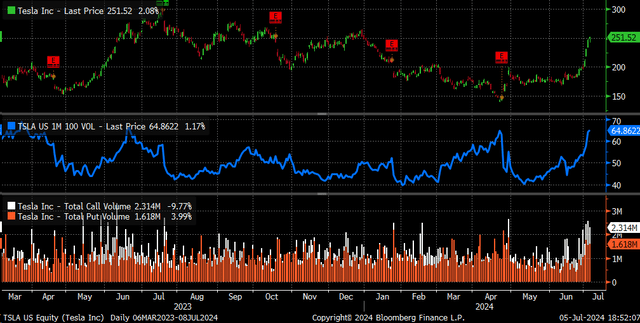
On July 5, it seemed to be Meta’s (META) turn because it appears to have been neglected for the most part. The stock jumped by nearly 6 percent, saw its implied volatility increase, and saw call volume rise more than double.
Bloomberg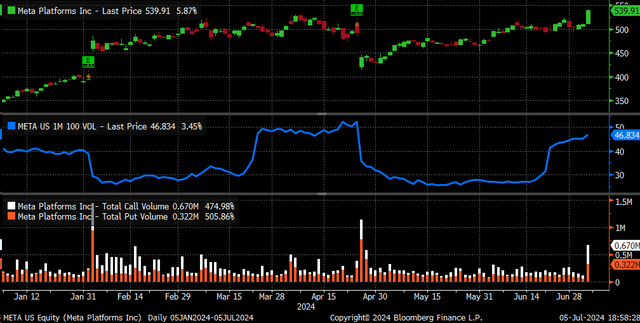
This is happening as the S&P 500 has continued to climb, and an at-the-money 1-month implied volatility for the index continued to move lower with spiking on a few occasions, above the usual range.
Bloomberg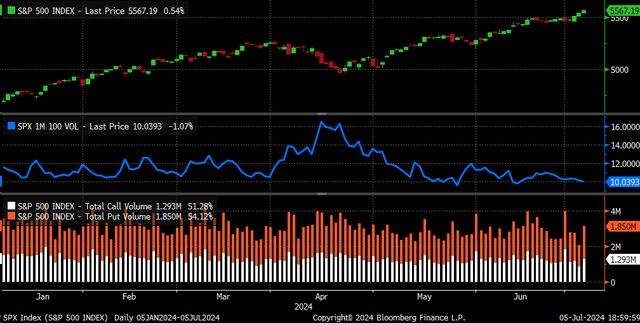
A Quarterly Game
Typically, we think about a gamma squeeze when considering a surging stock price, rising call volume, and increasing implied volatility. However, when we couple the rolling gamma squeezes across multiple names in the S&P 500 as implied volatility for the index is falling, it has the elements of a volatility dispersion trade, which has been noted before.
This trade is the most notable around earnings season, repeating seasonal and quarterly patterns. Typically, the implied volatility levels for these stocks rise about a month before earnings due to earnings risk and then drop sharply once earnings have passed.
Last year, this trade in Meta started around the end of June, with IV flattening out around July 6. It also coincided with a sharp rise in call volumes beginning on July 5 and then coming down slowly. The stock price rose from around $285 to $325 then. However, after the results, IV crashed, and the stock returned to around $285 over the next couple of weeks.
Bloomberg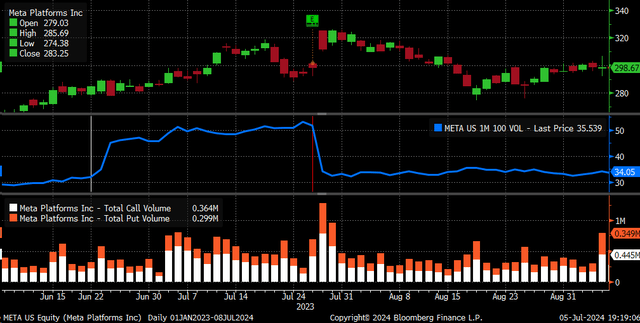
This pattern repeats about every quarter, starting one month before the earnings season begins and ending once earnings are reported.
Bloomberg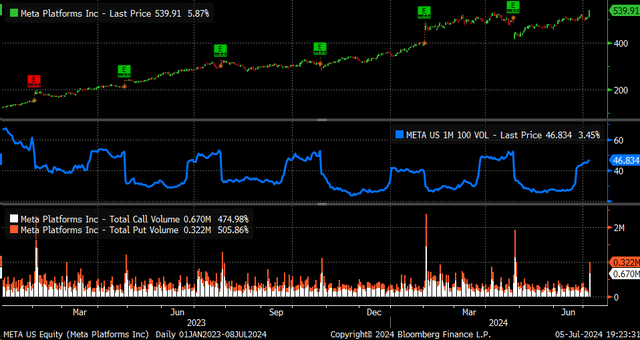
Correlations At All-Time Lows
This is why the 1-month implied correlation index has pushed on to new lows, falling below 4, and is now trading nearly three handles below its previous all-time lows set in 2017/18. This indicates that the current implied volatility across the 50 largest companies in the S&P 500 and index implied volatility levels are not moving in the same direction, and the lower the value, the weaker the correlation.
Bloomberg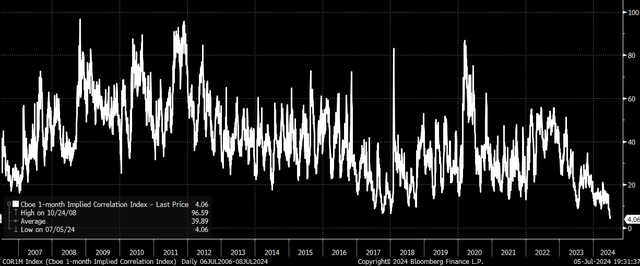
However, once implied volatility levels in the stocks peak, the implied correlation index will form a local bottom and, in most cases, turn higher. This would indicate that some kind of local bottom in the 1-month implied correlation is due very soon, with the potential for a turn higher.
Bloomberg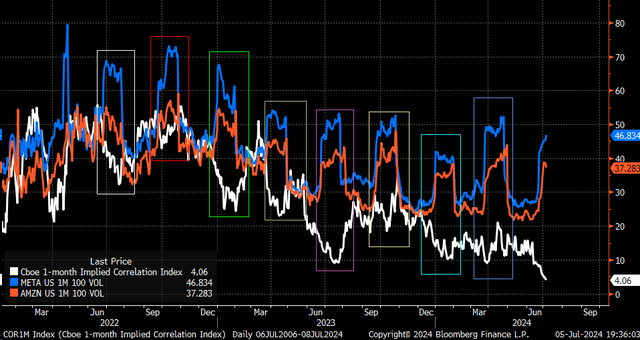
The 3-month, 9-month, and 12-month implied correlation indexes often flatten out or turn higher before the 1-month implied correlation indexes. This has happened many times over the past year alone. The 3-, 9-, and 12-month indexes could already be near a turning point.
Bloomberg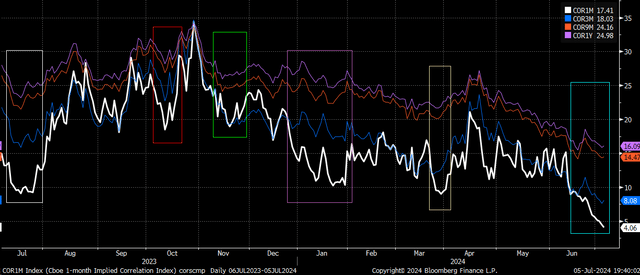
Blurred Vision
But this rotation into these differing stocks due to this trade is why we see this endless rotation in mega-cap names with big moves. It is noticeable, too, when breaking down the movements and the weightings of the stocks over those preferred time frames. From June 20 until June 26, the Bloomberg 500 shows that the stocks with the biggest impacts in the index, a proxy for the S&P 500, were Amazon, Alphabet, and Microsoft, with Tesla in fourth. This was over a stretch where 229 stocks were higher while 261 were lower.
Bloomberg
The period between June 27 and July 3 saw Tesla’s share surge, leading to the Bloomberg 500’s rise, followed by Apple and Microsoft. Tesla’s shares surged by more than 25% in that small trading window, adding more than $130 billion in market cap. During a period where the 257 stocks were higher and just 242 stocks were lower.
Bloomberg
On July 5, Apple and Meta led the tracking proxy higher, contributing 50% of the day’s gains, with Meta up nearly 6%. This was in the midst of a massive gamma squeeze, as the number of stocks higher was just 257, with 241 down.
Bloomberg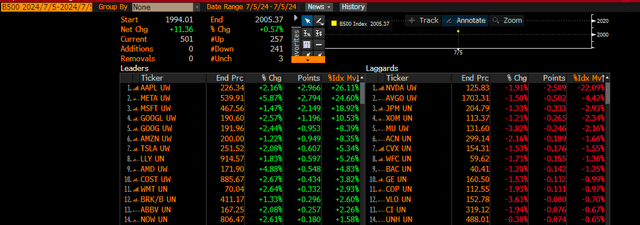
Overall, the Bloomberg 500 gained about 1.6% from June 20 through July 5, during which 252 stocks moved higher and 249 stocks moved lower. This was mainly due to what appears to be a volatility dispersion trade among a handful of the largest stocks in the market.
Bloomberg
So again, if it seems you are seeing things with a stock de jour weekly, you are not. It is accurate, and there is a reason for it.
This trade is very close to its end because of the seasonal cycles.
Read the full article here


