
 2026-05-13")


REIT Performance
After solid gains in both January and February, REITs sharply reversed in March with a brutal -7.52% return. The REIT sector turned in an even worse performance than the broader market as March saw substantial declines across the board from the Dow Jones Industrial Average (-5.2%), S&P 500 (-5.0%) and NASDAQ (-4.7%). The market cap weighted Vanguard Real Estate ETF (VNQ) saw a less negative total return than the average REIT in March (-6.31% vs. -7.52%) and has also outperformed year-to-date (1.32% vs. -2.22%). The spread between the 2026 FFO multiples of large cap REITs (16.3x) and small cap REITs (11.3x) widened in March as multiples contracted 1.1 turns for large caps and 2.2 turns for small caps. Investors currently need to pay an average of 44.2% more for each dollar of FFO from large cap REITs relative to small cap REITs. In this monthly publication, I will provide REIT data on numerous metrics to help readers identify which property types and individual securities currently offer the best opportunities to achieve their investment goals.
Source: Graph by Simon Bowler of 2nd Market Capital, Data compiled from S&P Global Market Intelligence LLC. See important notes and disclosures at the end of this article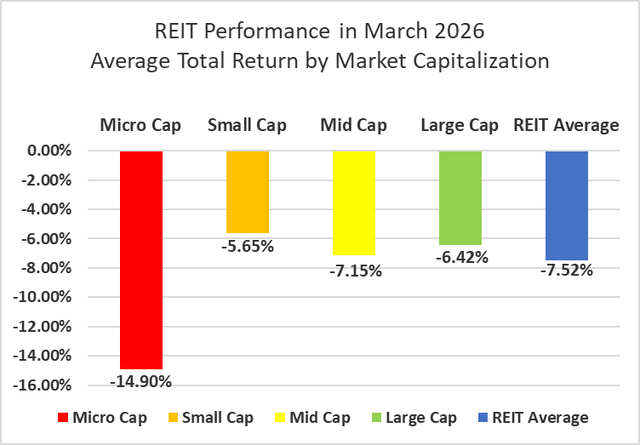
Micro cap REITs (-14.90%) have consistently underperformed their larger peers for a long time and that underperformance was particularly severe in March. Small caps (-5.65%) large caps (-6.42%) and mid caps (-7.15%) also had a tough month albeit with far smaller declines than micro caps. During the first quarter of 2026, small cap REITs outperformed large caps by 89 basis points.
Source: Graph by Simon Bowler of 2nd Market Capital, Data compiled from S&P Global Market Intelligence LLC. See important notes and disclosures at the end of this article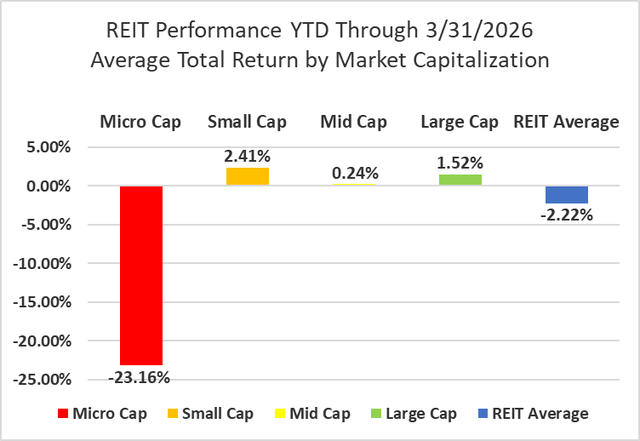
17 out of 18 Property Types Averaged Negative Returns in March
Only 5.56% of REIT property types averaged a positive total return in March with a 16.27% total return spread between the best and worst performing property types. Single Family Housing (+1.09%) was the sole property type in the black. Land (-15.18%) and Office (-14.50%) saw even steeper declines than the rest of the sector as they averaged double-digit negative returns in March.
Source: Table by Simon Bowler of 2nd Market Capital, Data compiled from S&P Global Market Intelligence LLC. See important notes and disclosures at the end of this article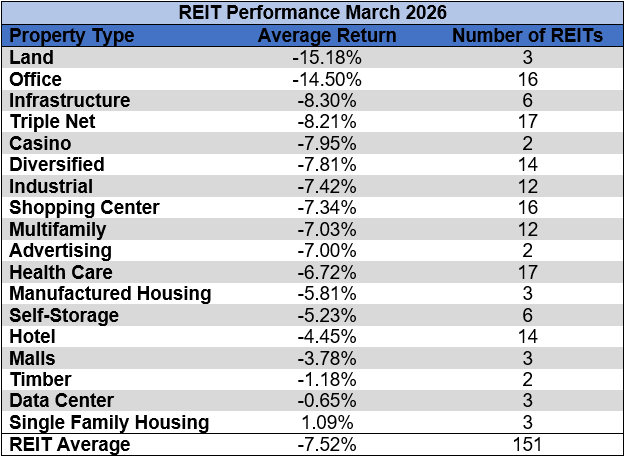
Office (-23.04%) is averaging a negative total return more than 3x as bad as any other property type thus far this year. Data Centers (+23.34%) and Land (+9.91%) saw the best average returns over the first quarter of the year.
Source: Table by Simon Bowler of 2nd Market Capital, Data compiled from S&P Global Market Intelligence LLC. See important notes and disclosures at the end of this article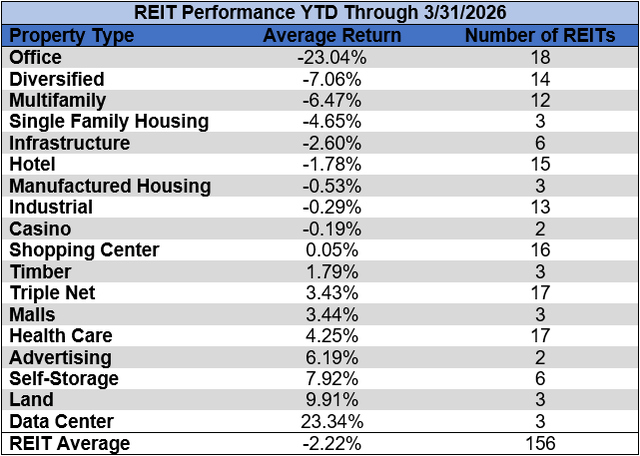
The REIT sector as a whole saw the average P/FFO (2026Y) decrease from 14.6x to 13.1x during March. 5.6% of property types averaged multiple expansion and 88.9% averaged multiple contraction with 5.6% holding at a steady multiple. Land (26.7x), Data Centers (26.5x), Timber (19.2x) and Manufactured Housing (17.4x) currently trade at the highest average multiples among REIT property types. Office (7.1x) and Hotels (8.3x) are the only property types that average single digit FFO multiples.
Source: Table by Simon Bowler of 2nd Market Capital, Data compiled from S&P Global Market Intelligence LLC. See important notes and disclosures at the end of this article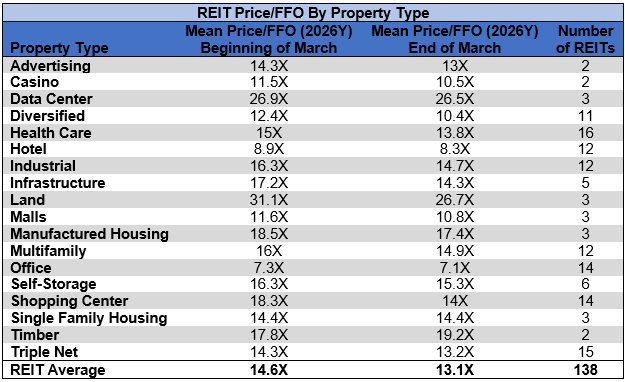
Performance of Individual Securities
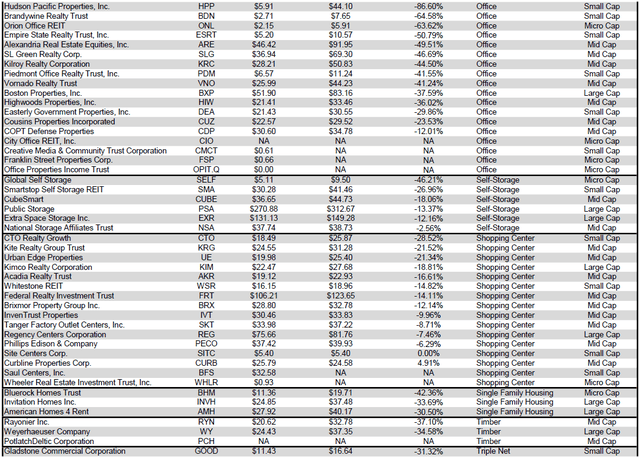
Alexander & Baldwin (ALEX) was taken private on March 12th in an all-cash transaction by a joint venture formed by an affiliate of MW Group and funds affiliated with Blackstone Real Estate and DivcoWest. ALEX shareholders received $20.85/share (the $21.20 transaction price less the $0.35 dividend paid in January).
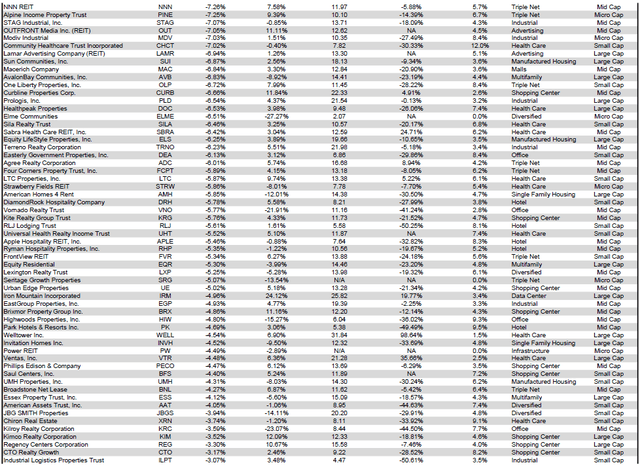
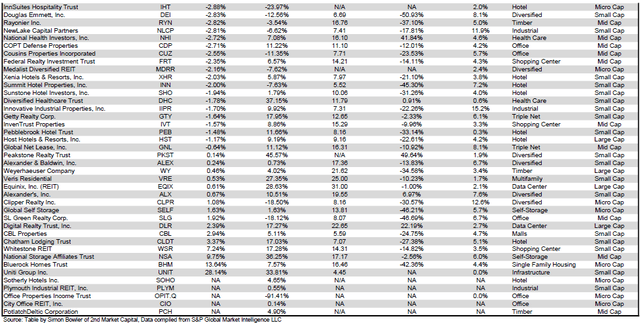
Uniti Group (UNIT) (+28.14%) was the best performing REIT in March. Uniti saw a sharp upward spike in share price at the end of the month when it was reported that T-Mobile US (TMUS) and TPG (TPG) are interested in buying segments of Uniti’s business. There is potential that the entire company could be sold. No formal offer has been made, but speculation for a potential sale fueled the strong March price increase.
Creative Media & Community Trust (CHCT) (-97.13%) managed to underperform even perpetually terrible Wheeler REIT (-51.28%) in March. CHCT posted enormously negative Q4 earnings and the occupancy of their struggling office portfolio plunged year-over-year from 81.7% down to only 74.8%.
Only 10.60% of REITs had a positive total return in March. REITs have averaged a -2.22% year-to-date total return in 2026, narrowly exceeding the -3.36% return for the REIT sector over the first three months of 2025.
For the convenience of reading this table in a larger font, the table below is available as a PDF as well.
Source: Table by Simon Bowler of 2nd Market Capital, Data compiled from S&P Global Market Intelligence LLC. See important notes and disclosures at the end of this article Source: Table by Simon Bowler of 2nd Market Capital, Data compiled from S&P Global Market Intelligence LLC. See important notes and disclosures at the end of this article Source: Table by Simon Bowler of 2nd Market Capital, Data compiled from S&P Global Market Intelligence LLC. See important notes and disclosures at the end of this article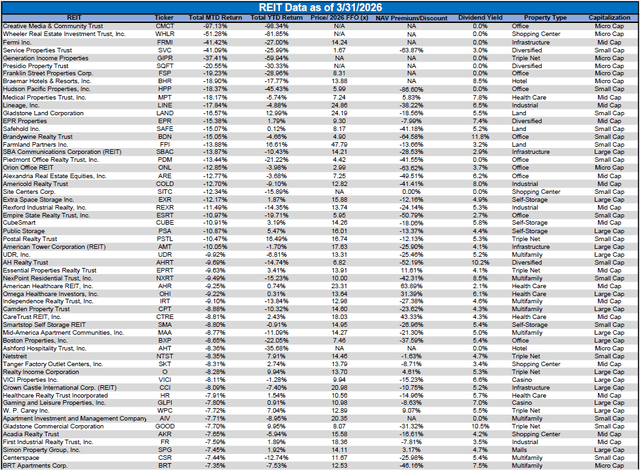
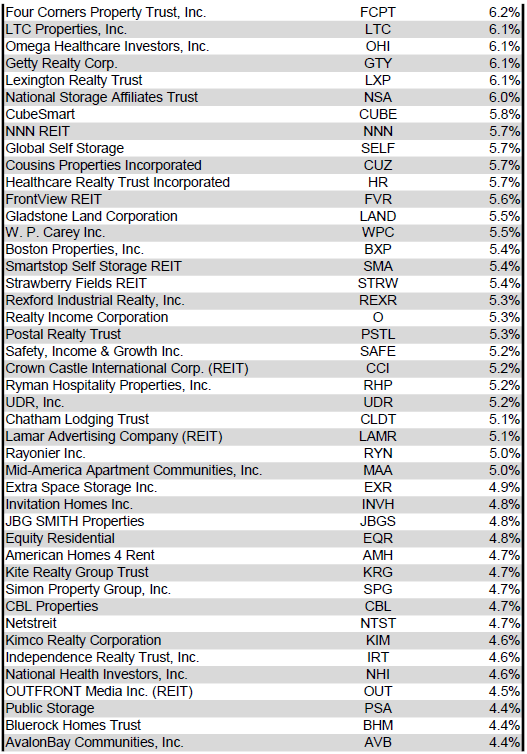
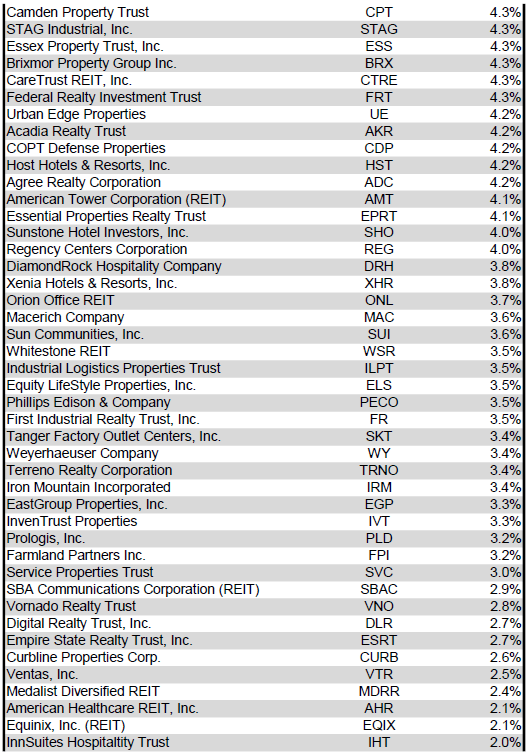
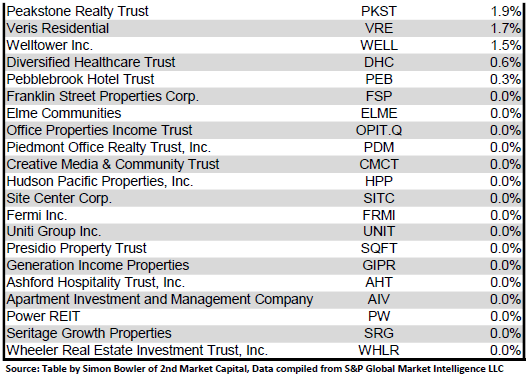
Dividend Yield
Dividend yield is an important component of a REIT’s total return. The particularly high dividend yields of the REIT sector are, for many investors, the primary reason for investment in this sector. As many REITs are currently trading at share prices well below their NAV, yields are currently quite high for many REITs within the sector. Although a particularly high yield for a REIT may sometimes reflect a disproportionately high risk, there exist opportunities in some cases to capitalize on dividend yields that are sufficiently attractive to justify the underlying risks of the investment. I have included below a table ranking equity REITs from highest dividend yield (as of 3/31/2026) to lowest dividend yield.
For the convenience of reading this table in a larger font, the table below is available as a PDF as well.
Source: Table by Simon Bowler of 2nd Market Capital, Data compiled from S&P Global Market Intelligence LLC. See important notes and disclosures at the end of this article Source: Table by Simon Bowler of 2nd Market Capital, Data compiled from S&P Global Market Intelligence LLC. See important notes and disclosures at the end of this article Source: Table by Simon Bowler of 2nd Market Capital, Data compiled from S&P Global Market Intelligence LLC. See important notes and disclosures at the end of this article Source: Table by Simon Bowler of 2nd Market Capital, Data compiled from S&P Global Market Intelligence LLC. See important notes and disclosures at the end of this article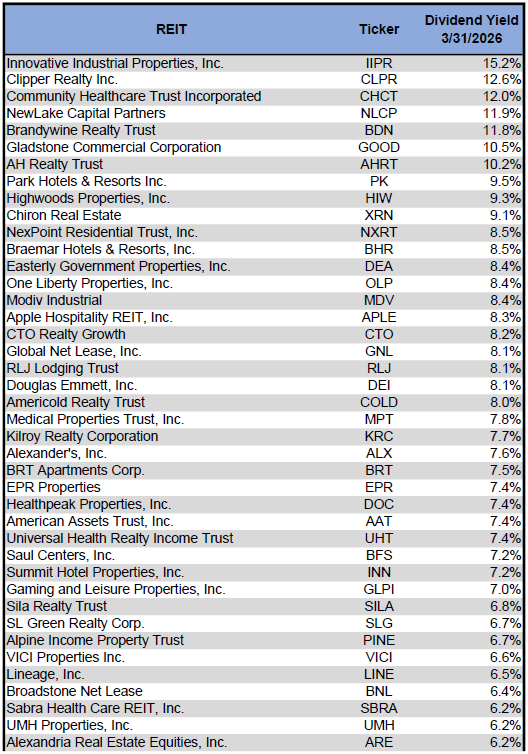
Although a REIT’s decision regarding whether to pay a quarterly dividend or a monthly dividend does not reflect on the quality of the company’s fundamentals or operations, a monthly dividend allows for smoother cash flow to the investor. Below is a list of equity REITs that pay monthly dividends ranked from highest yield to lowest yield.
Source: Table by Simon Bowler of 2nd Market Capital, Data compiled from S&P Global Market Intelligence LLC. See important notes and disclosures at the end of this article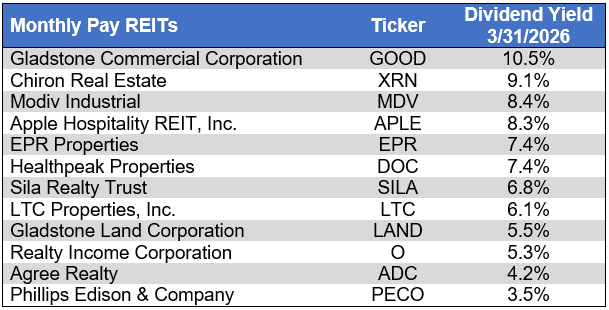
11 REITs raised their dividend in March, one of which is monthly and 10 of which are quarterly dividends. This brings the total number of REITs that have raised their dividends in 2026 up to 34. The biggest dividend hike in March was from CareTrust REIT (CTRE) with a 16.4% increase. The next largest increases came from Chatham Lodging Trust (CLDT) (+11.1%), Sun Communities (SUI) (+7.7%) and American Tower (AMT) (+5.3%).
Source: S&P Global Market Intelligence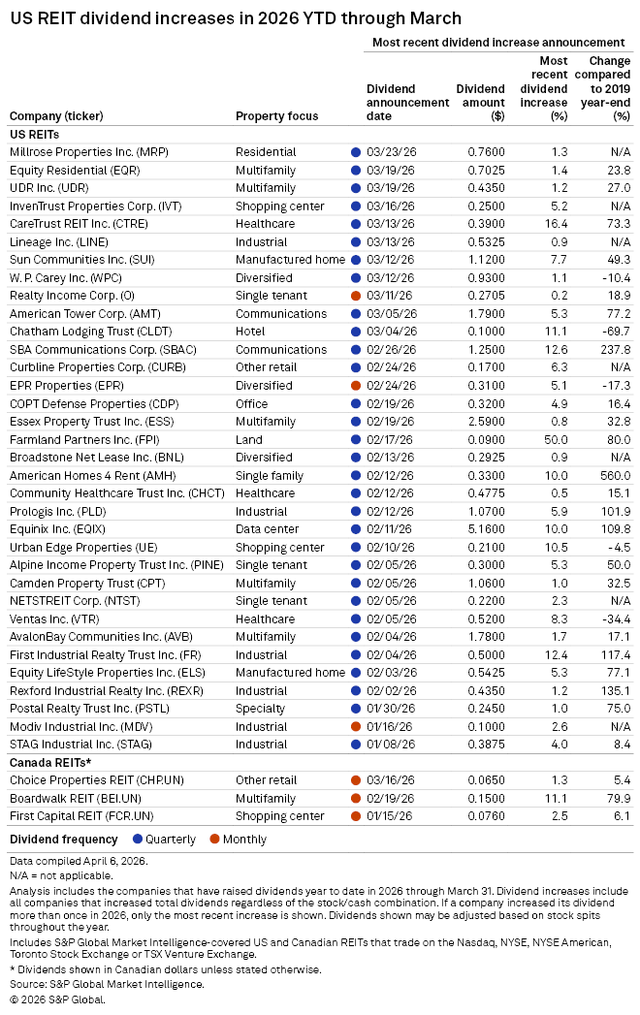
Valuation
REIT Premium/Discount to NAV by Property Type
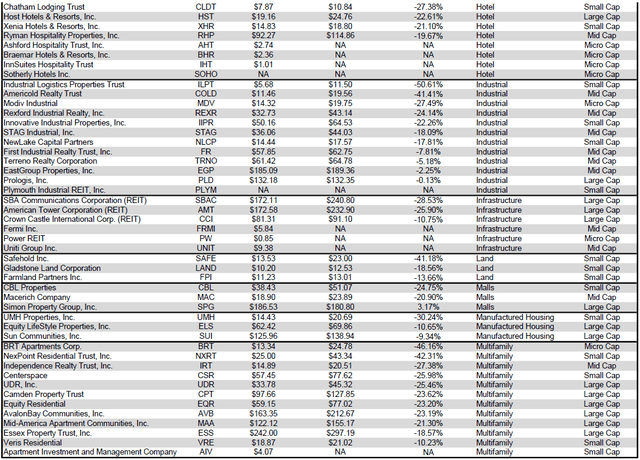
Below is a downloadable data table, which ranks REITs within each property type from the largest discount to the largest premium to NAV. The consensus NAV used for this table is the average of analyst NAV estimates for each REIT. Both the NAV and the share price will change over time, so I will continue to include this table in upcoming issues of The State of REITs with updated consensus NAV estimates for each REIT for which such an estimate is available.
For the convenience of reading this table in a larger font, the table below is available as a PDF as well.
Source: Table by Simon Bowler of 2nd Market Capital, Data compiled from S&P Global Market Intelligence LLC. See important notes and disclosures at the end of this article Source: Table by Simon Bowler of 2nd Market Capital, Data compiled from S&P Global Market Intelligence LLC. See important notes and disclosures at the end of this article Source: Table by Simon Bowler of 2nd Market Capital, Data compiled from S&P Global Market Intelligence LLC. See important notes and disclosures at the end of this article Source: Table by Simon Bowler of 2nd Market Capital, Data compiled from S&P Global Market Intelligence LLC. See important notes and disclosures at the end of this article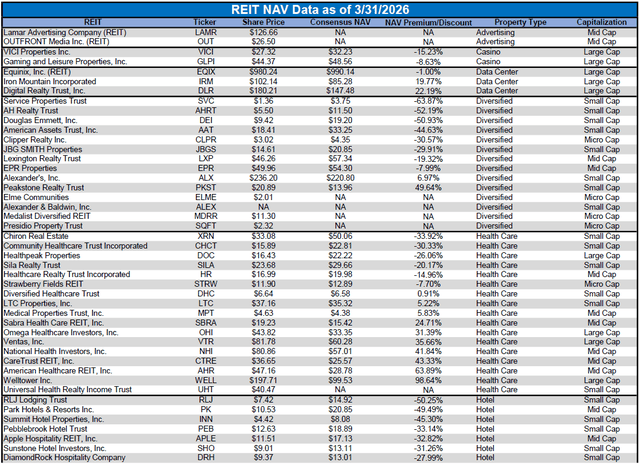
Takeaway
The large cap REIT premium (relative to small cap REITs) widened again in March and investors are now paying on average about 44% more for each dollar of 2026 FFO/share to buy large cap REITs than small cap REITs (16.3x/11.3x – 1 = 44.2%). As can be seen in the table below, there is presently a strong positive correlation between market cap and FFO multiple.
Source: Table by Simon Bowler of 2nd Market Capital, Data compiled from S&P Global Market Intelligence LLC. See important notes and disclosures at the end of this article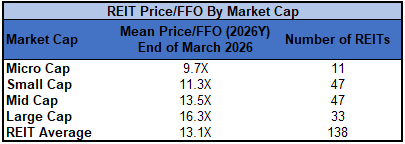
The table below shows the average NAV premium/discount of REITs of each market cap bucket. This data, much like the data for price/FFO, shows a strong, positive correlation between market cap and Price/NAV. The average large cap (-7.81%) trades at a single-digit discount to consensus NAV. Mid cap REITs (-12.82%) trade at a low double-digit discount. Small cap REITs (-27.27%) trade for less than 3/4 of NAV while micro caps (-34.81%) trade for a little less than 2/3 of their respective NAVs.
Source: Table by Simon Bowler of 2nd Market Capital, Data compiled from S&P Global Market Intelligence LLC. See important notes and disclosures at the end of this article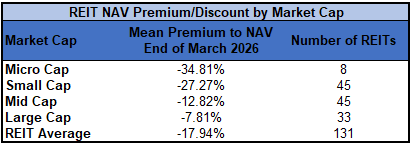
REIT Short Interest Continued to Rise in March as the REIT Sector Saw Its First 2026 IPO and Continued M&A Activity
Average short interest in REITs rose again in March, increasing another 25 basis points to 5.0%. The property types that saw the biggest increase in short interest were Office (+130 bps) and Timber (+79 bps). Farmland (-60 bps) saw the largest decrease in short interest in March followed by Shopping Centers (-44 bps).
Source: S&P Global Market Intelligence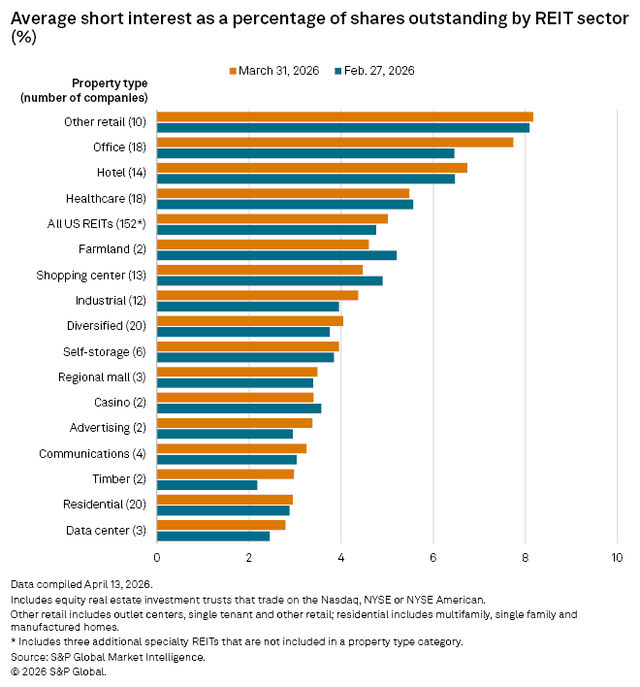
The REITs that saw the biggest increase in short interest during March were Creative Media & Community Trust (CMCT) with a massive +13.8 percentage points (pps) increase up to 16.5% short. Other REITs that saw large percentage point increases were SmartStop Self Storage REIT (SMA) (+2.9pps), EPR Properties (EPR) (+2.8pps) and Empire State Realty Trust (ESRT) (+2.4pps).
Source: S&P Global Market Intelligence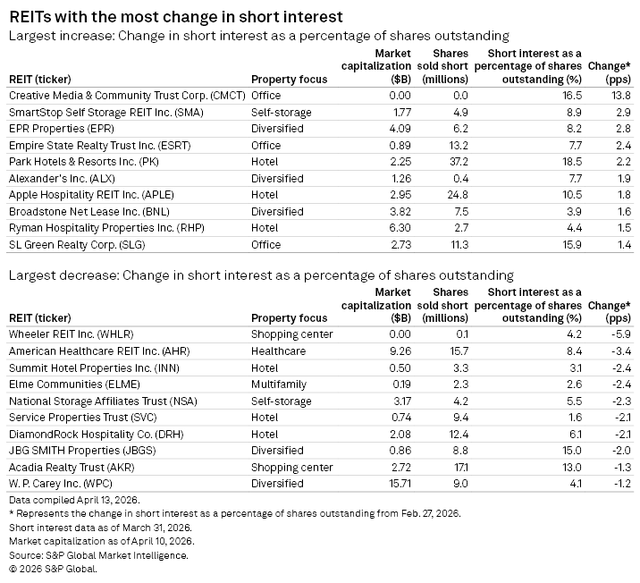
Some REITs bucked the overall uptrend in short interest during March, most notably Wheeler REIT (WHLR) (-5.9pps), American Healthcare REIT (AHR) (-3.4pps), Summit Hotel Properties (INN) (-2.4pps) and Elme Communities (ELME) (-2.4pps).
Source: S&P Global Market Intelligence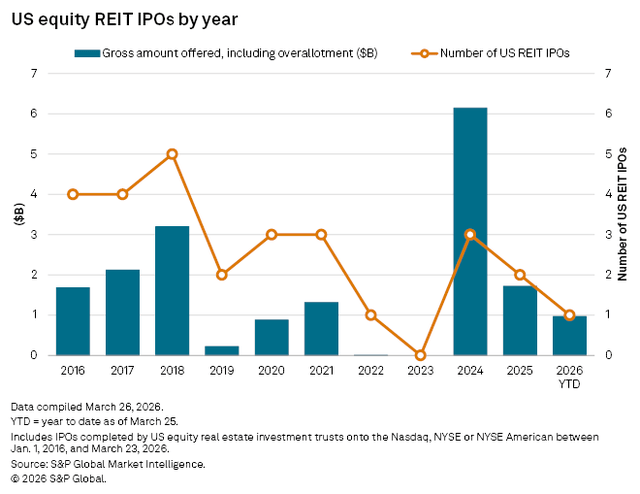
Janus Living (JAN), a senior housing spinoff from Healthpeak Properties (DOC) began trading on March 19th. This was the first equity REIT IPO since Fermi (FRMI) in September 2025 and only the 7th equity REIT IPO since the beginning of 2022. National Healthcare Properties (NHP), another senior housing REIT, will be the 2nd 2026 REIT IPO in April. Both of NHP’s preferred tickers, (NHPAP) and (NHPBP) are already publicly traded.
Source: S&P Global Market Intelligence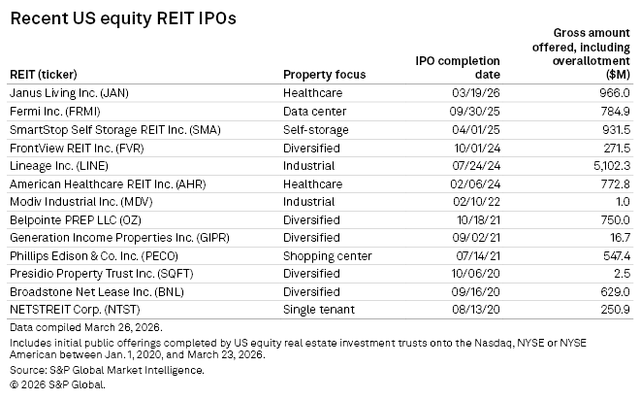
The REIT sector has seen elevated M&A over the past 2 quarters. Q4 2025 (4 M&A deals) and Q1 2026 (3 M&A deals) each saw more deals than any other quarter since Q2 2023. Q1 2026 also saw the highest REIT M&A total deal value of any quarter since the 2nd quarter of 2023.
Source: S&P Global Market Intelligence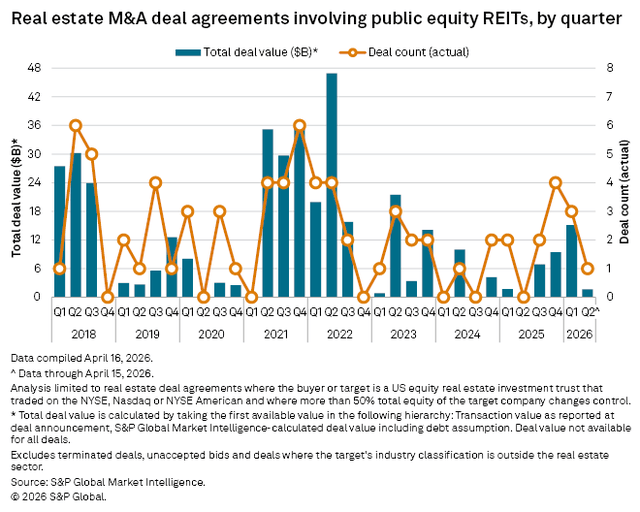
The REITs that have already accepted takeout bids thus far in 2026 are Peakstone Realty Trust (PKST), Veris Residential (VRE), National Storage Affiliates Trust (NSA), Whitestone REIT (WSR) and Sila Realty Trust (SILA). Each of the 5 acquired REITs represents a different REIT property type, demonstrating the breadth of M&A opportunities across the sector.
Source: S&P Global Market Intelligence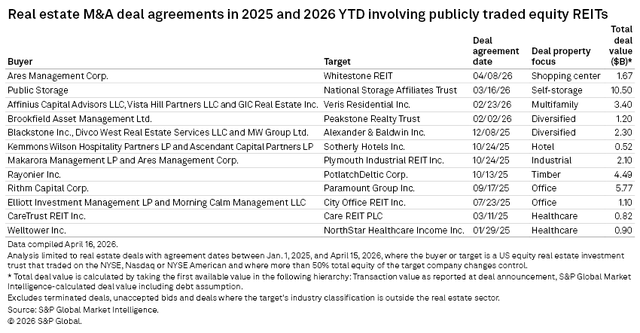
The increased acquisition interest in REITs is due in large part to the excessive NAV discounts throughout the sector. Large REITs and private equity have capitalized on the opportunity to buy large portfolios of high quality assets at attractive prices via acquiring a discounted REIT rather than buying multiple smaller portfolios at full price in the private sector. If NAV discounts across the REIT sector don’t substantially narrow, there could be many more REITs receiving takeout bids in 2026. This presents a potential opportunity for REIT investors who are able to successfully identify likely acquisition targets. These REITs could see strong 2026 total returns via either discounted share prices moving up toward NAV or an accepted takeout bid well above the current NAV discount.
Read the full article here
 2026-05-13")

")
")

")
